Does the location of your seat in a classroom play a role in attendance or grade? 1600 students in a physics course were randomly assigned to one of four groups. The 400 students in group 1 sat 0 to 4 meters from the front of the class, the 400 students in group 2 sat 4 to 6.5 meters from the front, the 400 students in group 3 sat 6.5 to 9 meters from the front, and the 400 students in group 4 sat 9 to 12 meters from the front. Complete parts (a) through (c). Click the icon to view the chi-square table of critical values. (a) For the first half of the semester, the attendance for the whole class averaged 83%. So, if there is no effect due to seat location, we would expect 83% of students in each group to attend. The data show the attendance history for each group. How many students in each group attended, on average? Is there a significant difference among the groups in attendance patterns? Group Attendance 2 3 4 0.84 0.84 0.84 0.80 The number of students who attended in the first group was 336. The number of students who attended in the second group was 336. The number of students who attended in the third group was 336. The number of students who attended in the fourth group was 320 . What are the hypotheses? Họ: The average attendance in each group is the same as the average attendance for the class. H4: The average attendance in each group is different from the average attendance for the class. What is the test statistic? Xổ =(Round to three decimal places as needed.)
Does the location of your seat in a classroom play a role in attendance or grade? 1600 students in a physics course were randomly assigned to one of four groups. The 400 students in group 1 sat 0 to 4 meters from the front of the class, the 400 students in group 2 sat 4 to 6.5 meters from the front, the 400 students in group 3 sat 6.5 to 9 meters from the front, and the 400 students in group 4 sat 9 to 12 meters from the front. Complete parts (a) through (c). Click the icon to view the chi-square table of critical values. (a) For the first half of the semester, the attendance for the whole class averaged 83%. So, if there is no effect due to seat location, we would expect 83% of students in each group to attend. The data show the attendance history for each group. How many students in each group attended, on average? Is there a significant difference among the groups in attendance patterns? Group Attendance 2 3 4 0.84 0.84 0.84 0.80 The number of students who attended in the first group was 336. The number of students who attended in the second group was 336. The number of students who attended in the third group was 336. The number of students who attended in the fourth group was 320 . What are the hypotheses? Họ: The average attendance in each group is the same as the average attendance for the class. H4: The average attendance in each group is different from the average attendance for the class. What is the test statistic? Xổ =(Round to three decimal places as needed.)

Glencoe Algebra 1, Student Edition, 9780079039897, 0079039898, 2018
18th Edition
ISBN:9780079039897
Author:Carter
Publisher:Carter
Chapter10: Statistics
Section10.6: Summarizing Categorical Data
Problem 13CYU

Related questions

Question
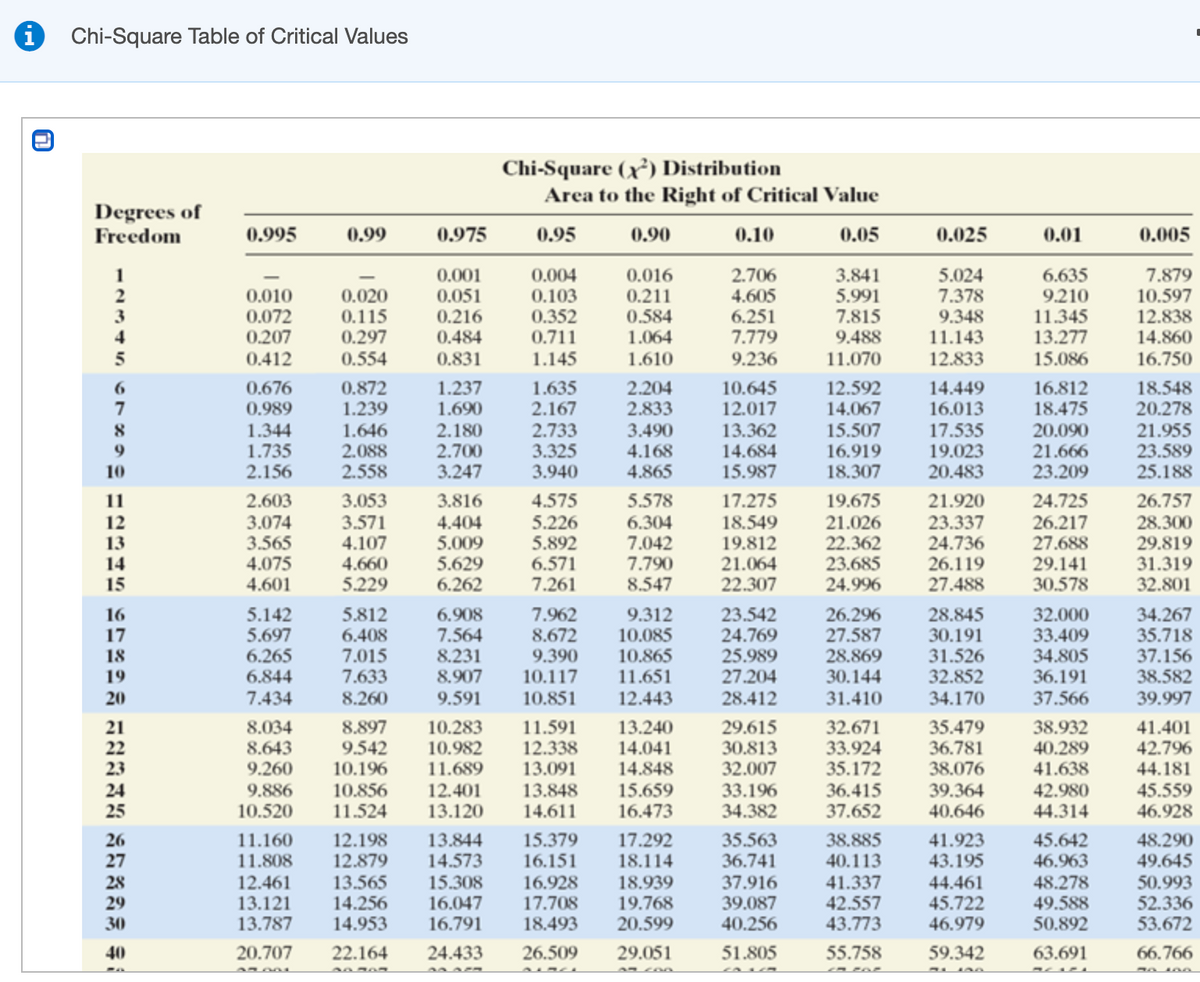
Transcribed Image Text:Chi-Square Table of Critical Values
Chi-Square (x³) Distribution
Area to the Right of Critical Value
Degrees of
Freedom
0.995
0.99
0.975
0.95
0.90
0.10
0.05
0.025
0.01
0.005
0.001
0.051
0.216
0.484
7.879
10.597
12.838
14.860
16.750
0.004
0.010
0.072
0.207
0.020
0.115
0.297
0.554
0.103
0.352
0.711
1.145
0.016
0.211
0.584
1.064
1.610
2.706
4.605
6.251
7.779
9.236
3.841
5.991
7.815
5.024
7.378
9.348
11.143
12.833
6.635
9.210
11.345
13.277
15.086
9.488
0.412
0.831
11.070
1.237
1.690
2.180
2.700
3.247
12.592
14.067
15.507
16.919
18.307
16.812
18.475
20.090
21.666
23.209
18.548
20.278
21.955
23.589
25.188
0.872
1.239
1.635
2.167
2.733
3.325
3.940
2.204
2.833
0.676
0.989
1.344
1.735
2.156
1.646
2.088
2.558
3.490
4.168
4.865
10.645
12.017
13.362
14.684
15.987
14.449
16.013
17.535
19.023
20.483
8
21.920
23.337
24.736
26.119
27.488
24.725
26.217
27.688
29.141
30.578
26.757
28.300
29.819
31.319
32.801
2.603
3.053
3.816
4.575
5.578
6.304
7.042
7.790
8.547
11
17.275
19.675
3.074
3.565
4.075
4.601
3.571
4.107
4.660
5.229
4.404
5.009
5.629
6.262
5.226
5.892
6.571
7.261
18.549
19.812
21.064
22.307
21.026
22.362
23.685
24.996
12
13
14
15
5.142
5.697
6.265
23.542
24.769
25.989
27.204
28.412
32.000
33.409
34.805
36.191
37.566
34.267
35.718
37.156
38.582
39.997
5.812
7.962
8.672
9.390
10.117
9.312
10.085
10.865
11.651
12.443
26.296
27.587
28.869
30.144
31.410
28.845
30.191
31.526
32.852
34.170
16
6.908
7.564
8.231
8.907
17
6.408
7.015
7.633
8.260
18
19
6.844
7.434
20
9.591
10.851
8.897
9.542
10.196
10.856
11.524
10.283
10.982
11.689
12.401
13.120
29.615
30.813
32.007
33.196
34.382
8.034
21
22
23
24
8.643
9.260
9.886
10.520
11.591
12.338
13.091
13.848
14.611
13.240
14.041
14.848
15.659
16.473
32.671
33.924
35.172
36.415
37.652
35.479
36.781
38.076
39.364
40.646
38.932
40.289
41.638
42.980
44.314
41.401
42.796
44.181
45.559
46.928
26
27
28
29
30
35.563
36.741
37.916
39.087
40.256
15.379
16.151
17.292
11.160
11.808
12.461
13.121
13.787
12.198
12.879
13.565
14.256
14.953
13.844
14.573
15.308
16.047
16.791
16.928
17.708
18.493
18.114
18.939
19.768
20.599
38.885
40.113
41.337
41.923
43.195
44.461
45.722
46.979
45.642
46.963
48.278
49.588
50.892
48.290
49.645
50.993
52.336
53.672
42.557
43.773
40
20.707
22.164
24.433
26.509
29.051
51.805
55.758
59.342
63.691
66.766
123 5
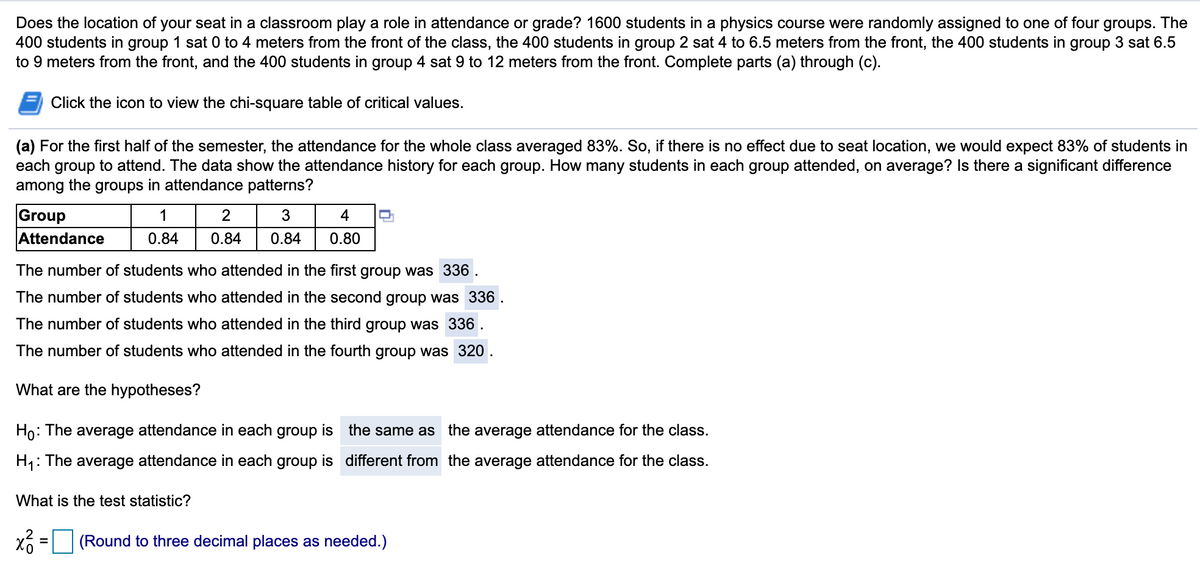
Transcribed Image Text:Does the location of your seat in a classroom play a role in attendance or grade? 1600 students in a physics course were randomly assigned to one of four groups. The
400 students in group 1 sat 0 to 4 meters from the front of the class, the 400 students in group 2 sat 4 to 6.5 meters from the front, the 400 students in group 3 sat 6.5
to 9 meters from the front, and the 400 students in group 4 sat 9 to 12 meters from the front. Complete parts (a) through (c).
Click the icon to view the chi-square table of critical values.
(a) For the first half of the semester, the attendance for the whole class averaged 83%. So, if there is no effect due to seat location, we would expect 83% of students in
each group to attend. The data show the attendance history for each group. How many students in each group attended, on average? Is there a significant difference
among the groups in attendance patterns?
Group
Attendance
1
3
4
0.84
0.84
0.84
0.80
The number of students who attended in the first group was 336 .
The number of students who attended in the second group was 336.
The number of students who attended in the third group was 336.
The number of students who attended in the fourth group was 320.
What are the hypotheses?
Ho: The average attendance in each group is the same as the average attendance for the class.
H1: The average attendance in each group is different from the average attendance for the class.
What is the test statistic?
(Round to three decimal places as needed.)
Expert Solution
This question has been solved!
Explore an expertly crafted, step-by-step solution for a thorough understanding of key concepts.

This is a popular solution!

Trending now
This is a popular solution!

Step by step
Solved in 4 steps with 6 images

Knowledge Booster


Learn more about
Need a deep-dive on the concept behind this application? Look no further. Learn more about this topic, statistics and related others by exploring similar questions and additional content below.Recommended textbooks for you
Glencoe Algebra 1, Student Edition, 9780079039897…
Algebra
ISBN:
9780079039897
Author:
Carter
Publisher:
McGraw Hill

Holt Mcdougal Larson Pre-algebra: Student Edition…
Algebra
ISBN:
9780547587776
Author:
HOLT MCDOUGAL
Publisher:
HOLT MCDOUGAL
Glencoe Algebra 1, Student Edition, 9780079039897…
Algebra
ISBN:
9780079039897
Author:
Carter
Publisher:
McGraw Hill
Holt Mcdougal Larson Pre-algebra: Student Edition…
Algebra
ISBN:
9780547587776
Author:
HOLT MCDOUGAL
Publisher:
HOLT MCDOUGAL