Does the t test indicate a significant relationship between price and the overall score? Compute the value of the t test statistic. Use x=0.05
Does the t test indicate a significant relationship between price and the overall score? Compute the value of the t test statistic. Use x=0.05

Chapter3: Polynomial Functions
Section3.5: Mathematical Modeling And Variation
Problem 1ECP: The ordered pairs below give the median sales prices y (in thousands of dollars) of new homes sold...

Related questions
Topic Video
Question
#a. Does the t test indicate a significant relationship between price and the overall score?
Compute the value of the t test statistic. Use x=0.05
Transcribed Image Text:napters 12 and 13
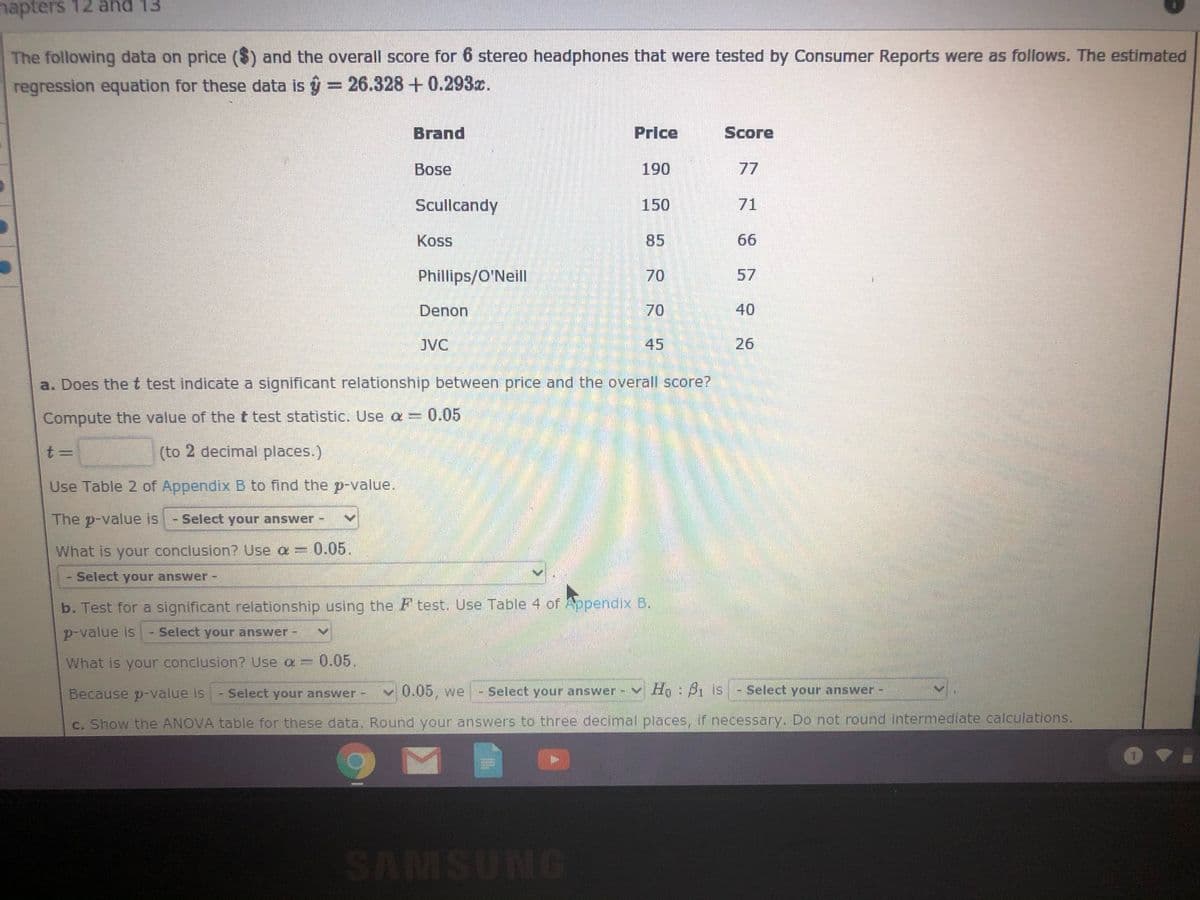
The following data on price ($) and the overall score for 6 stereo headphones that were tested by Consumer Reports were as follows. The estimated
regression equation for these data is y = 26.328 +0.293x.
Brand
Price
Score
Bose
190
77
Scullcandy
150
71
Koss
85
66
Phillips/O'Neill
70
57
Denon
70
40
JVC
45
26
a. Does the t test indicate a significant relationship between price and the overall score?
Compute the value of the t test statistic. Use a-0.05
t3=
(to 2 decimal places.)
Use Table 2 of Appendix B to find the p-value.
The p-value is
Select your answer
What is your conclusion? Use a = 0.05.
Select your answer-
b. Test for a significant relationship using the F test. Use Table 4 of Appendix B.
p-value is - Select your answer
What is your conclusion? Use a 0.05,
Because p-value is - Select your answer
0.05, we
Select your answer - v Ho: A1 is- Select your answer -
C. Show the ANOVA table for these data. Round your answers to three decimal places, if necessary. Do not round intermediate calculations.
Expert Solution
This question has been solved!
Explore an expertly crafted, step-by-step solution for a thorough understanding of key concepts.

This is a popular solution!

Trending now
This is a popular solution!

Step by step
Solved in 4 steps with 6 images

Knowledge Booster


Learn more about
Need a deep-dive on the concept behind this application? Look no further. Learn more about this topic, statistics and related others by exploring similar questions and additional content below.Recommended textbooks for you

Functions and Change: A Modeling Approach to Coll…
Algebra
ISBN:
9781337111348
Author:
Bruce Crauder, Benny Evans, Alan Noell
Publisher:
Cengage Learning

Glencoe Algebra 1, Student Edition, 9780079039897…
Algebra
ISBN:
9780079039897
Author:
Carter
Publisher:
McGraw Hill
Functions and Change: A Modeling Approach to Coll…
Algebra
ISBN:
9781337111348
Author:
Bruce Crauder, Benny Evans, Alan Noell
Publisher:
Cengage Learning
Glencoe Algebra 1, Student Edition, 9780079039897…
Algebra
ISBN:
9780079039897
Author:
Carter
Publisher:
McGraw Hill