$ 5 A В S 5 5 D D C D The above figure illustrates four markets, each with an equilibrium price of 5. If a sales tax of 1 was applied, which of these markets would see the largest decrease in the price earned by suppliers? %24 %24 %24
$ 5 A В S 5 5 D D C D The above figure illustrates four markets, each with an equilibrium price of 5. If a sales tax of 1 was applied, which of these markets would see the largest decrease in the price earned by suppliers? %24 %24 %24

Chapter3: Supply And Demand: Theory
Section: Chapter Questions
Problem 1WNG

Related questions
Question
100%
Transcribed Image Text:$
D
S
5
D
A
В
$
D
D
D
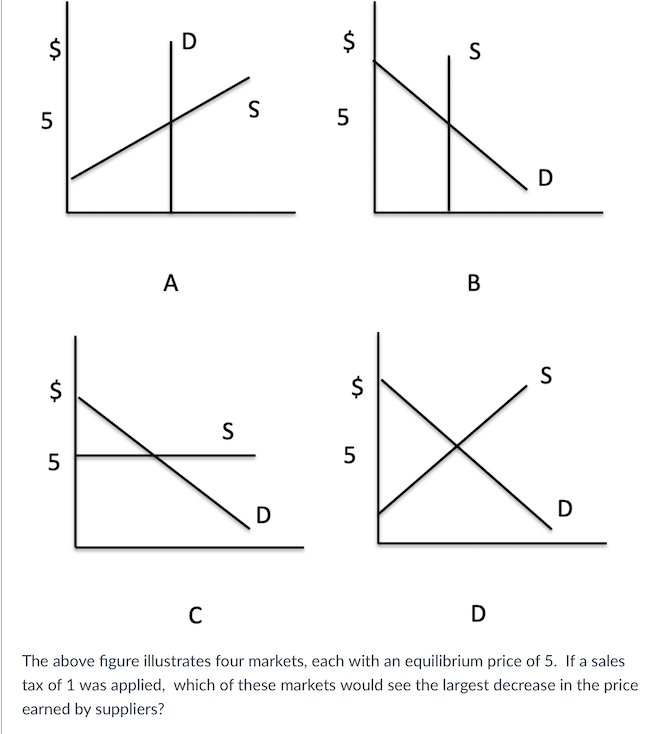
The above figure illustrates four markets, each with an equilibrium price of 5. If a sales
tax of 1 was applied, which of these markets would see the largest decrease in the price
earned by suppliers?
%24
Expert Solution
This question has been solved!
Explore an expertly crafted, step-by-step solution for a thorough understanding of key concepts.

Step by step
Solved in 2 steps

Recommended textbooks for you

Economics (MindTap Course List)
Economics
ISBN:
9781337617383
Author:
Roger A. Arnold
Publisher:
Cengage Learning

Economics (MindTap Course List)
Economics
ISBN:
9781337617383
Author:
Roger A. Arnold
Publisher:
Cengage Learning

Principles of Macroeconomics (MindTap Course List)
Economics
ISBN:
9781305971509
Author:
N. Gregory Mankiw
Publisher:
Cengage Learning

Principles of Economics 2e
Economics
ISBN:
9781947172364
Author:
Steven A. Greenlaw; David Shapiro
Publisher:
OpenStax
