($ in millions) Surf City Paradise Falls 2021 2020 2021 2020 Total assets $19,828 $19,804 $39,161 $38,637 Total liabilities 11,519 11,396 15,232 14,805 Total stockholders' equity 8,309 8,408 23,929 23,832 Sales revenue $ 7,688 $15,382 Interest expense 356 336 Тах еxpensе 4 Net income 18 1,298
Q: For the next fiscal year, you forecast net income of $49,600 and ending assets of $505,800. Your…
A: Debt equity ratio = total debts/ shareholders fund Share holders include share capital ,reserves and…
Q: Referring to the following data of the Omani Company, answer A and B: - (Note; Write all related…
A: Current ratio: It is the liquidity ratio that depicts the ability of the company to pay its…
Q: Use the information presented in Southwestern Mutual Bank's balance sheet to answer the following…
A: Financial leverage ratios helps in evaluating the financial leverage of business in terms of its…
Q: The company plans to efficiently maintain the assets in the long run. The average total assets of…
A: Hey, since there are multiple requirements posted, we will answer first three requirements. If you…
Q: based on the ratio analysis below will the company be successful after taking a 500.0 mil loan to…
A: Liquidity ratio determines the ability of the company to meet its short term obligations. Both…
Q: A Company has adopted a policy whereby it will seek any additional external financing as well as…
A: Growth rate of a firm can be calculated as follows, = Retention Ratio * Internal rate of return
Q: Question / If we have capital 10,000,000, retained earnings 5,000,000, reserves 3,000,000, personal…
A: Equity means all amount pertaining to the shareholders or owners of the business.
Q: Credit analyst is evaluating the solvency of Alcatel as of the beginning of 2005. The following data…
A: Hi There, Thanks for posting the question. Per Q&A guidelines, The first question must be…
Q: calculate the • efficiency ratios, • liquidity ratios, • leverage ratios, and • profitability ratios…
A: Based on the income statement and balance sheet of KPC corporation for the current year and the last…
Q: Based on the financial statements calculate the (1) efficiency ratios, (2) liquidity ratios, (3)…
A: A financial ratio, also known as an accounting ratio, is the comparison of two numerical numbers…
Q: Refer to the data for Pettijohn Inc. What is the firm's quick ratio? 0.49 0.61 O 0.73 0.87 O 1.05…
A: Quick Ratio = (Cash & Cash Equivalents + Accounts Receivables) / Current Liabilities Return on…
Q: Gaspares Agricultural Cooperative has current liabilities of $162,500, net working capital of…
A:
Q: based on the financial ratio anaylsis of the company below, will the comapny be successful after…
A: Ratio measurement is in terms of Financial world, depicts that a single accounting figure by itself…
Q: Identifying why companies invest and classifying investments Garden Haven has excess cash of $15,000…
A: Investments: Companies invest in stocks and bonds of other companies or governmental entity to…
Q: The following table represents the annual trend of net profit of two different companies The…
A:
Q: Presented below are three different transactions related to materiality. Explain whether you would…
A: Materiality concept: The accounting concept which focusses that all the financial items and…
Q: tial analysis should include the following: The ratio equation The calculation of the ratio using…
A: Times-interest-earned ratio: The time interest earned ratio aids in determining the company's…
Q: Upon further investigation, you have found that the amount of account payables for Companies A and X…
A: The relationship between two figures from two different balance sheet dates is represented by…
Q: Jay Oullette, CEO of Bumper to Bumper Inc., anticipates that his company's year-end balance sheet…
A: Working capital refers to a company's ability to manage day-to-day expenses and includes inventory,…
Q: During the past year, the company introduced several new product lines and raised the selling prices…
A: Note: Hi! Thank you for the question, As per the honor code, we are allowed to answer three…
Q: Using WACC, ignoring taxes, compute the cost of capital of a company with debt ratio of 0.75:1 and…
A: Debt ratio = 0.75 Equity ratio = 1-0.75 = 0.25 Debt cost = 4% Equity cost = 5%
Q: calculate the efficiency ratios, liquidity ratios, leverage ratios, and profitability ratios for KPC…
A: Ratio analysis is one of the important technique of analysis for financial statements. Under this,…
Q: Suppose you had the following propositions of returns from two companies W and Y: Company…
A: An investor should put in the money in the company W because it has more value as compared to…
Q: Identify the ratio that is relevant to answering each of the following questions.a. How much net…
A: Hello, I am only answering first three sub-parts as per the policy and if you want the others to be…
Q: Silver Inc. will be registering with SEC. Its incorporators was able to gather the following cost of…
A: The minimum return on investment is the minimum expected profit on the investment made by the…
Q: Starborn Company has just been established as a new company to manufacture furniture. The company…
A: Balance sheet: The balance sheet shows the financial position of the company by recording all the…
Q: A firm is fully invested in commercial real estate. The commercial real estate it owns experienced a…
A: Debt refers to the funds raised from the outside sources in order to finance the business…
Q: Presented below are three different transactions related to materiality. Explain whether you would…
A:
Q: what is the potential loss or gain to equity holders’ net worth?
A: Situation of potential loss or gain for equity holders' net worth arises when there is probability…
Q: Upon further investigation, you have found that the amount of account payables for Companies A and X…
A: The ratio is a tool to measure the growth and performance of the company by establishing the…
Q: Bank Y and Bank Z both have assets of $1 billion. The return on assets for both banks is the same.…
A: Equity is the ownership of a person or business within a company and Debt is borrowed money which…
Q: As the newly-appointed Chief Financial Officer of BnB Construction Inc. State whether the company is…
A: Financial ratios: Financial ratios are the evaluators of the company's profitability, solvency and…
Q: based on the given industry averages. Write the answers in the spaces provided.
A: Disclaimer: Since you have asked multiple question, we will solve the first question for you. If you…
Q: Meade Publications is a magazine publisher established in Southern California. Financial analysts…
A: Return on equity indicates the financial performance of the firm. It can be calculated by dividing…
Q: The below information relates to Drake Ltd which manufactures and sells commercial kitchen…
A: a.Drake Ltd borrowed an additional $200,000 as short-term, 6-month loan from the bank:- Profit…
Q: computing the profitability
A: Net profit ratio = Net income * 100/Net sales Particulars 2014 2015 Net income P482 m P587.7 m…
Q: Calculating Profitability Ratios Wims, Inc., has sales of $15.2 million, total assets of $9.8…
A: The Profit margin ratio measures the amount of net income earned with each sale. It measures the…
Q: Based on the preceding information, your calculations, and your assumptions, which of the following…
A: The following are the statements that will be included: (B) Cute camel woodcraft firm's ability to…
Q: (Financing decisions) Brussels Electronics, Inc, has total assets of $64 million and total debt of…
A: Brussels Electronic's debt ratio- = Total debt/ Total assets = $45/ $64 = 0.7031 or 70%
Q: Now it's time for you to practice what you've learned. Suppose that you are given the following data…
A: Ratio analysis is a quantitative method to know the liquidity, operational efficiency, and…
Q: 1. The company manager targets to increase the current ratio in the year (2021) by 30% out of the…
A: Total Asset Turnover Ratio = Total Sales/ Total Assets Total Assets = current assets + fixed assets…
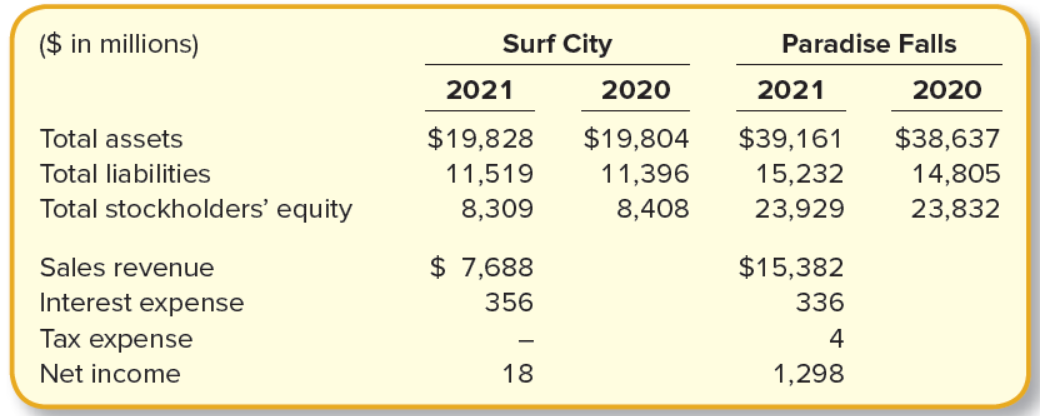
Selected financial data for Surf City and Paradise Falls are as follows:
Required:
1. Calculate the debt to equity ratio for Surf City and Paradise Falls for the most recent year. Which company has the higher ratio?
2. Calculate the return on assets for Surf City and Paradise Falls. Which company appears more profitable?
3. Calculate the times interest earned ratio for Surf City and Paradise Falls. Which company is better able to meet interest payments as they become due?
Trending now
This is a popular solution!
Step by step
Solved in 3 steps with 3 images
- 39 Atlanta Corporation, a domestic corporation, had the following data for the years 2022 and 2023: 2022 2023 Sales P 10,000,000 P 15,000,000 Cost of sales 4,000,000 6,000,000 Deductible expenses 6,100,000 7,000,000 Capital gains 50,000 100,000 Interest income on trade notes receivable 10,000 30,000 Rent income 430,000 600,000 Total assets 500,000,000 550,000,000 How much is the total deferred charges in 2023?SME Balance Sheet 2021 2020 Assets (in millions) Cash 85.960 56.460 Receivables 89.560 80.670 Inventories 55.750 41.260 Other Current Assets 9.950 6.760 Total Current Assets 241.220 185.150 Net Property, Plant, and Equipment 78.970 68.930 Goodwill and Other Intangible Assets 103.110 104.360 Other Non-Current Assets 6.900 4.200 Total Assets 430.200 362.640 Total Liabilities and Shareholders' Equity Payables 83.240 57.48 Current Debt 2.700 2.64 Total Current Liabilities 85.940 60.120 Long-Term Debt 122.000 119.62 Other Liabilities 21.880 22.58 Total Liabilities 229.820 202.320 Common Stock 200.380 160.32 Total Equity 200.38 160.32 Total Liabilities and Equity 430.200 362.640 INCOME STATEMENT 2021 Total Revenue (M) 488.10…SME Balance Sheet 2021 2020 Assets (in millions) Cash 85.960 56.460 Receivables 89.560 80.670 Inventories 55.750 41.260 Other Current Assets 9.950 6.760 Total Current Assets 241.220 185.150 Net Property, Plant, and Equipment 78.970 68.930 Goodwill and Other Intangible Assets 103.110 104.360 Other Non-Current Assets 6.900 4.200 Total Assets 430.200 362.640 Total Liabilities and Shareholders' Equity Payables 83.240 57.48 Current Debt 2.700 2.64 Total Current Liabilities 85.940 60.120 Long-Term Debt 122.000 119.62 Other Liabilities 21.880 22.58 Total Liabilities 229.820 202.320 Common Stock 200.380 160.32 Total Equity 200.38 160.32 Total Liabilities and Equity 430.200 362.640 INCOME STATEMENT 2021 Total Revenue (M) 488.10…
- SME Balance Sheet 2021 2020 Assets (in millions) Cash 85.960 56.460 Receivables 89.560 80.670 Inventories 55.750 41.260 Other Current Assets 9.950 6.760 Total Current Assets 241.220 185.150 Net Property, Plant, and Equipment 78.970 68.930 Goodwill and Other Intangible Assets 103.110 104.360 Other Non-Current Assets 6.900 4.200 Total Assets 430.200 362.640 Total Liabilities and Shareholders' Equity Payables 83.240 57.48 Current Debt 2.700 2.64 Total Current Liabilities 85.940 60.120 Long-Term Debt 122.000 119.62 Other Liabilities 21.880 22.58 Total Liabilities 229.820 202.320 Common Stock 200.380 160.32 Total Equity 200.38 160.32 Total Liabilities and Equity 430.200 362.640 INCOME STATEMENT 2021 Total Revenue (M) 488.10…SME Balance Sheet 2021 2020 Assets (in millions) Cash 85.960 56.460 Receivables 89.560 80.670 Inventories 55.750 41.260 Other Current Assets 9.950 6.760 Total Current Assets 241.220 185.150 Net Property, Plant, and Equipment 78.970 68.930 Goodwill and Other Intangible Assets 103.110 104.360 Other Non-Current Assets 6.900 4.200 Total Assets 430.200 362.640 Total Liabilities and Shareholders' Equity Payables 83.240 57.48 Current Debt 2.700 2.64 Total Current Liabilities 85.940 60.120 Long-Term Debt 122.000 119.62 Other Liabilities 21.880 22.58 Total Liabilities 229.820 202.320 Common Stock 200.380 160.32 Total Equity 200.38 160.32 Total Liabilities and Equity 430.200 362.640 INCOME STATEMENT 2021 Total Revenue (M) 488.10…SME Balance Sheet 2021 2020 Assets (in millions) Cash 85.960 56.460 Receivables 89.560 80.670 Inventories 55.750 41.260 Other Current Assets 9.950 6.760 Total Current Assets 241.220 185.150 Net Property, Plant, and Equipment 78.970 68.930 Goodwill and Other Intangible Assets 103.110 104.360 Other Non-Current Assets 6.900 4.200 Total Assets 430.200 362.640 Total Liabilities and Shareholders' Equity Payables 83.240 57.48 Current Debt 2.700 2.64 Total Current Liabilities 85.940 60.120 Long-Term Debt 122.000 119.62 Other Liabilities 21.880 22.58 Total Liabilities 229.820 202.320 Common Stock 200.380 160.32 Total Equity 200.38 160.32 Total Liabilities and Equity 430.200 362.640 INCOME STATEMENT 2021 Total Revenue (M) 488.10…
- Particulars 31st Mar' 19 Amt (Rs) 31st Mar' 20 Amt (Rs) Land and Building 3600000 3600000 Cash 400000 320,000 Sundry Debtors 640000 800,000 Temporary Investments 400000 640,000 Stock 3680000 4320000 Prepaid Expenses 560000 24000 Plant and Machinery 1920000 3096000 Total Assets 11200000 12800000 Current Liabilities 1280000 1600000 Loans 3200000 3200000 Capital 4000000 4000000 Retained Earnings 936000 1624000 Statement of Profit for the Current Year 1st Apr to 31st Mar' 20 : Amt (Rs) Sales 8000000 Less: Cost of Goods Sold -5600000 Less: Interest -320000 Net Profit 2080000 Less: Taxes @ 50% -1040000 Profit after Tax 1040000 Profit Distributed 440000 Calculate Gross Profit Ratio Return on EquityParticulars 31st Mar' 19 Amt (Rs) 31st Mar' 20 Amt (Rs) Land and Building 3600000 3600000 Cash 400000 320,000 Sundry Debtors 640000 800,000 Temporary Investments 400000 640,000 Stock 3680000 4320000 Prepaid Expenses 560000 24000 Plant and Machinery 1920000 3096000 Total Assets 11200000 12800000 Current Liabilities 1280000 1600000 Loans 3200000 3200000 Capital 4000000 4000000 Retained Earnings 936000 1624000 Statement of Profit for the Current Year 1st Apr to 31st Mar' 20 : Amt (Rs) Sales 8000000 Less: Cost of Goods Sold -5600000 Less: Interest -320000 Net Profit 2080000 Less: Taxes @ 50% -1040000 Profit after Tax 1040000 Profit Distributed 440000 Calculate Current Ratio Debtors Turnover Ratio Stock Turnover Ratio Return on Total AssetsBnB Construction Inc.Balance Sheet (Millions of Dollars) Assets 2021 Est 2020 2019 Liabilities 2021 Est 2020 2019 Cash and Cash Equivalents 15 10 15 Accounts payable 115 60 30 Short-Term Investments 10 0 65 Overdrafts 115 110 60 Accounts Receivable 420 375 315 Accruals 260 140 130 Inventories 700 615 415 Total Current Liabilities 490 310 220 Total Current Assets 1145 1000 810 Long -Term Bonds and New Loan 1300 754 580 Net Plant and Equipment 1884 1190 870 Total Debt 1790 1064 800 Preferred Stock 40 40 40 Common Stock 130 130 130 Retained Earnings 1069 956 710 Total Common Equity 1199 1086 840 Total Assets 3029 2190 1680 Total Liabilities and Equity 3,029 2,190 1,680 Included is the Income Statement. Requirements: 1. Calculate the EPS, DPS, and BVPS, and Cash…