
Cornerstones of Financial Accounting
4th Edition
ISBN:9781337690881
Author:Jay Rich, Jeff Jones
Publisher:Jay Rich, Jeff Jones
Chapter12: Fainancial Statement Analysis
Section: Chapter Questions
Problem 52CE: Asset Efficiency Ratios Selected financial statement numbers for Rutherford Company follow....

Related questions
Question
Is the estimate of $35 to $40 for Owen’s shares a fair evaluation? Explain. Type a three- to four-sentence response below.
|
Ratio Type |
2012 |
2013 |
|
Current (times) |
3.40 |
3.43 |
|
Quick (times) |
2.18 |
1.83 |
|
Debt (%) |
37.65% |
35.31% |
|
Times interest earned (times) |
8.50 |
11.61 |
|
Inventory turnover (times) |
6.99 |
4.79 |
|
Total asset turnover (times) |
2.78 |
2.71 |
|
Average collections period (days) |
50.14 |
50.99 |
|
|
11.60 |
10.81 |
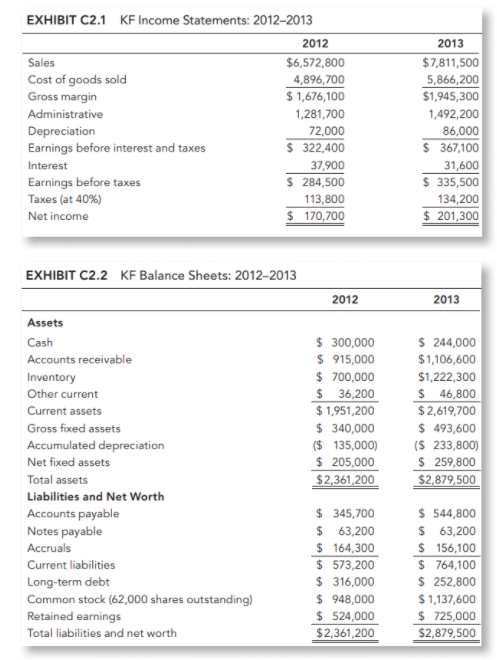
Transcribed Image Text:EXHIBIT C2.1 KF Income Statements: 2012–2013
2012
2013
Sales
$6,572,800
$7,811,500
5,866,200
Cost of goods sold
Gross margin
4,896,700
$ 1,676,100
$1,945,300
Administrative
1,281,700
1,492,200
Depreciation
Earnings before interest and taxes
72,000
$ 322,400
86,000
$ 367,100
31,600
$ 335,500
Interest
37,900
$ 284,500
Earnings before taxes
Taxes (at 40%)
113,800
134,200
$ 170,700
$ 201,300
Net income
EXHIBIT C2.2 KF Balance Sheets: 2012–2013
2012
2013
Assets
$ 300,000
$ 915,000
$ 700,000
$ 36,200
$ 1,951,200
$ 340,000
($ 135,000)
$ 205,000
$2,361,200
$ 244,000
$1,106,600
$1,222,300
$ 46,800
Cash
Accounts receivable
Inventory
Other current
Current assets
$2,619,700
$ 493,600
($ 233,800)
$ 259,800
Gross fixed assets
Accumulated depreciation
Net fixed assets
Total assets
$2,879,500
Liabilities and Net Worth
$ 345,700
$ 63,200
$ 164,300
$ 573,200
$ 316,000
$ 948,000
$ 524,000
$2,361,200
$ 544,800
$ 63,200
$ 156,100
$ 764,100
$ 252,800
$ 1,137,600
$ 725,000
$2,879,500
Accounts payable
Notes payable
Accruals
Current liabilities
Long-term debt
Common stock (62,000 shares outstanding)
Retained earnings
Total liabilities and net worth
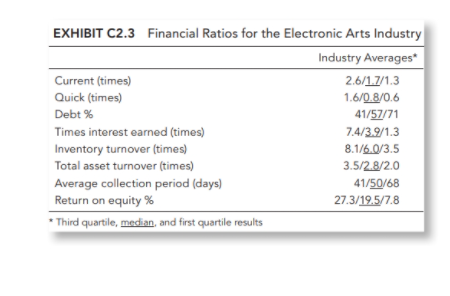
Transcribed Image Text:EXHIBIT C2.3 Financial Ratios for the Electronic Arts Industry
Industry Averages
Current (times)
2.6/1.7/1.3
Quick (times)
1.6/0.8/0.6
Debt %
41/57/71
Times interest earned (times)
7.4/3.9/1.3
Inventory turnover (times)
Total asset turnover (times)
8.1/6.0/3.5
3.5/2.8/2.0
Average collection period (days)
Return on equity %
41/50/68
27.3/19.5/7.8
* Third quartile, median, and first quartile results
Expert Solution
This question has been solved!
Explore an expertly crafted, step-by-step solution for a thorough understanding of key concepts.

This is a popular solution!

Trending now
This is a popular solution!

Step by step
Solved in 3 steps

Knowledge Booster


Learn more about
Need a deep-dive on the concept behind this application? Look no further. Learn more about this topic, finance and related others by exploring similar questions and additional content below.Recommended textbooks for you
Cornerstones of Financial Accounting
Accounting
ISBN:
9781337690881
Author:
Jay Rich, Jeff Jones
Publisher:
Cengage Learning

Survey of Accounting (Accounting I)
Accounting
ISBN:
9781305961883
Author:
Carl Warren
Publisher:
Cengage Learning

Accounting (Text Only)
Accounting
ISBN:
9781285743615
Author:
Carl Warren, James M. Reeve, Jonathan Duchac
Publisher:
Cengage Learning
Cornerstones of Financial Accounting
Accounting
ISBN:
9781337690881
Author:
Jay Rich, Jeff Jones
Publisher:
Cengage Learning
Survey of Accounting (Accounting I)
Accounting
ISBN:
9781305961883
Author:
Carl Warren
Publisher:
Cengage Learning
Accounting (Text Only)
Accounting
ISBN:
9781285743615
Author:
Carl Warren, James M. Reeve, Jonathan Duchac
Publisher:
Cengage Learning