downstream from the factory. Producing an additional ton of bolts imposes a constant marginal external cost (MEC) of $315 per ton. The following graph shows the demand (marginal private benefits, or MPB) curve and the supply (marginal private costs, or MPC) curve for bolts. Use the purple points (diamond symbol) to plot the marginal social costs (MSC) curve when the marginal external cost is $315 per ton. PRECE (Dolars per ton of bots) 010 640 210 100 2 QUANTITY (Tons of bolts) 6 Supply (MPC) Demand (MPB) MSC
downstream from the factory. Producing an additional ton of bolts imposes a constant marginal external cost (MEC) of $315 per ton. The following graph shows the demand (marginal private benefits, or MPB) curve and the supply (marginal private costs, or MPC) curve for bolts. Use the purple points (diamond symbol) to plot the marginal social costs (MSC) curve when the marginal external cost is $315 per ton. PRECE (Dolars per ton of bots) 010 640 210 100 2 QUANTITY (Tons of bolts) 6 Supply (MPC) Demand (MPB) MSC

Chapter17: Externalities And The Environment
Section: Chapter Questions
Problem 2.5P

Related questions
Question
please label the MSC points on graph thank you
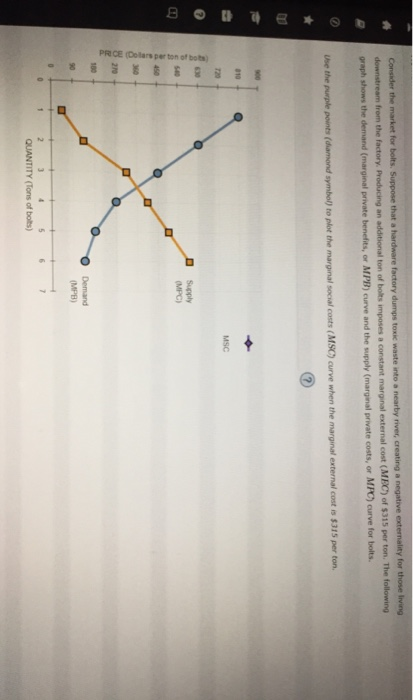
Transcribed Image Text:Consider the market for bolts. Suppose that a hardware factory dumps toxic waste into a nearby river, creating a negative externality for those living
downstream from the factory. Producing an additional ton of bolts imposes a constant marginal external cost (MEC) of $315 per ton. The following
graph shows the demand (marginal private benefits, or MPB) curve and the supply (marginal private costs, or MPC) curve for bolts.
Use the purple points (diamond symbol) to plot the marginal social costs (MSC) curve when the marginal external cost is $315 per ton.
PRECE (Dollars per ton of bots)
810
720
630
540
450
270
100
90
2
D
3
QUANTITY (Tons of bolts)
6
Supply
(MPC)
Demand
(MPB)
MSC
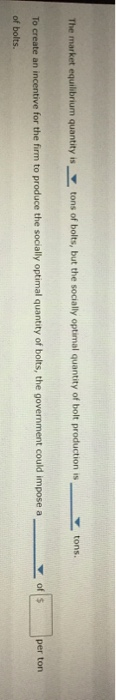
Transcribed Image Text:The market equilibrium quantity is,
tons of bolts, but the socially optimal quantity of bolt production is
To create an incentive for the firm to produce the socially optimal quantity of bolts, the government could impose a
of bolts.
tons.
of $
per ton
Expert Solution
This question has been solved!
Explore an expertly crafted, step-by-step solution for a thorough understanding of key concepts.

Step by step
Solved in 5 steps with 2 images

Knowledge Booster


Learn more about
Need a deep-dive on the concept behind this application? Look no further. Learn more about this topic, economics and related others by exploring similar questions and additional content below.Recommended textbooks for you

Essentials of Economics (MindTap Course List)
Economics
ISBN:
9781337091992
Author:
N. Gregory Mankiw
Publisher:
Cengage Learning

Principles of Microeconomics (MindTap Course List)
Economics
ISBN:
9781305971493
Author:
N. Gregory Mankiw
Publisher:
Cengage Learning
Essentials of Economics (MindTap Course List)
Economics
ISBN:
9781337091992
Author:
N. Gregory Mankiw
Publisher:
Cengage Learning
Principles of Microeconomics (MindTap Course List)
Economics
ISBN:
9781305971493
Author:
N. Gregory Mankiw
Publisher:
Cengage Learning

Principles of Economics 2e
Economics
ISBN:
9781947172364
Author:
Steven A. Greenlaw; David Shapiro
Publisher:
OpenStax

Principles of Microeconomics
Economics
ISBN:
9781305156050
Author:
N. Gregory Mankiw
Publisher:
Cengage Learning

Economics (MindTap Course List)
Economics
ISBN:
9781337617383
Author:
Roger A. Arnold
Publisher:
Cengage Learning