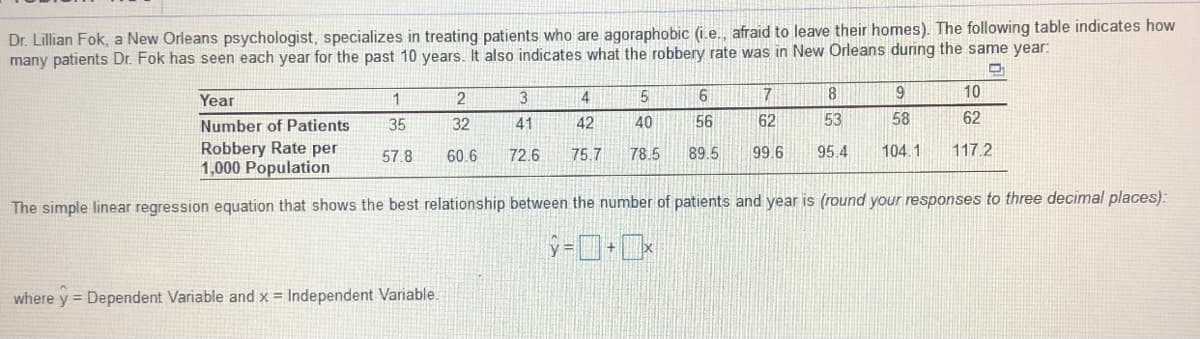
Dr. Lillian Fok, a New Orleans psychologist, specializes in treating patients who are agoraphobic (i.e., afraid to leave their homes). The following table indicates how many patients Dr. Fok has seen each year for the past 10 years. It also indicates what the robbery rate was in New Orleans during the same year: Year 1 2 3 6. 7 10 Number of Patients 35 32 41 42 40 56 62 53 58 62 Robbery Rate per 1,000 Population 57.8 60.6 72.6 75.7 78.5 89.5 99.6 95.4 104.1 117.2 The simple linear regression equation that shows the best relationship between the number of patients and year is (round your responses to three decimal places): where y = Dependent Variable and x = Independent Variable.


Q: Ayuni is an entrepreneur who specializes in baking. She has been operating her business from home…
A: Customer satisfaction measures how happy customers are with a product or service. Believe it or not,…
Q: The Sea Wharf Restaurant would like to determine the best way to allocate a monthly advertising…
A: Objective Functions and Constraints: Based on the given details, the objective…
Q: Use the following information for the next four questions: On Jan. 1, 20x1, Red Co. acquires…
A: Principal Amount = ₽500,000 Interest = ₽50,000
Q: Maximus Steel plans to introduce one of three new products code-named: Wren, Hawk, and Nightingale.…
A: The expected value of each alternative given below: i) Profit favorable Wren $120,000 0.2…
Q: 4.Hilltop Coffee manufactures a coffee product by blending three types of coffee beans. The cost per…
A: Decision variables: Let x be no. of pounds of bean 1y be no. of pounds of bean 2z be no. of pounds…
Q: Dr. Lillian Fok, a New Orleans psychologist, specializes in treating patients who are agoraphobic…
A: Year No. of Patients ( X ) Robbery rate ( Y ) XY X2 1 36 58.00 2088 1296 2 34 61.10 2077.4 1156…
Q: employer
A: Maternity leave in the United States is according to the US labor laws. This type of leave is…
Q: Dr. Lillian Fok, a New Orleans psychologist, specializes in treating patients who are agoraphobic…
A: Given that: Year (N) Number of Patients(x) Roberry Rate(y) 1 35 57.8 2 32 60.6 3 41…
Q: Pick all the correct answers. If you had to present quantitative data, select all the ones you can…
A: When considering strategic management, research is an important activity of the manager of an…
Q: National Foods Company has five plants where it processes and packages fruits and vegetables. It has…
A: Formula:
Q: A retail store in Des Moines, Iowa, receives shipments of a particular product from Kansas City and…
A: a. Total number of units of the product received by the retail store in Des Moines =x+y Because,…
Q: The simple linear regression equation that shows the best relationship between the number of…
A: Forecasting is a technique used to predict future outcomes on the basis of past data. In business…
Q: The services provided by a personal fitness trainer are best described as which of the following:…
A: Customer service is the art of serving the customers before and after the purchase of a product. The…
Q: 1. Gina's target population for her study are employees from the top 500 corporations in the…
A: 1. Simple random sampling: In this sampling method every individual from population gets an equal…
Q: State some key types of applications of the minimum spanning tree problem?
A: A minimum spanning tree (MST) or minimum weight spanning tree is a subset of the edges of an…
Q: Dr. Lillian Fok, a New Orleans psychologist, specializes in treating patients who are agoraphobic…
A:
Q: a) The center-of-gravity coordinates for the location of the proposed outlet in Mobile, Alabama…
A: Center of gravity coordinaqtes will be calculated as: X-axis = Total of Product of population with…
Q: The following data is given x 0.2 0.5 1 2 3 y 3 2 1.4 1 0.6 Using the transformed…
A:
Q: Dr. Lillian Fok, a New Orleans psychologist, specializes in treating patients who are agoraphobic…
A:
Q: Dr. Lillian Fok, a New Orleans psychologist, specializes in treating patients who are agoraphobic…
A: Given that: Robbery Rate(x) Number of Patients(y) 57.8 35 60.6 33 73 39 75.2 41 78.5…
Q: Describe two (2) positive and two (2) negative effects, decisions etc., that a rise in the price of…
A: Feed shortage, livestock diseases, low productivity, water scarcity and predators in descending…
Q: How to solve descision tree using Analytical Solver for the assignment below Chelsea Bush is an…
A: a) Chelsea should run in the NH essential. On the off chance that she progresses admirably, at that…
Q: The Mega-Bucks Corporation is planning its production schedule for the next four weeks and is…
A: Given, Forecasted Demand of Compound X Week Demand 1 400 lbs. 2 150 lbs.…
Q: A company wants to forecast demand using the weighted moving average. If the company uses two prior…
A: Weighted moving average (WMA) = Wt * Vt
Q: SportTech Events: SportTech Events puts on athletic events for local high school athletes. The…
A: Below is the solution:-
Q: An electronics manufacturer is introducing seven new electronic products. Each of its eight plants…
A: Given data is
Q: 2. Dwight Melody is the manager of a large farm with 1,000 acres of arable land. For greater…
A: Weather Dry Moderate Damp Probability 0.3 0.5 0.2 Crop 1 20 35 40 Crop 2 22.5 30 45 Crop…
Q: Example 3. The age of mothers and the average number of children born per mother are given in the…
A: Age of Mother (X) Avg no. of children (Y) 15-19 X0 0.7 Y0 20-24 X1 2.1 Y1 25-29 X2 3.5 Y2…
Q: 1. Sara is planning to start a new designer cloth shop. Her problem is to decide how large her shop…
A: The Laplace criterion: The Laplace criterion manages all the knowledge by assigning similar…
Q: Use the technique developed in this section to solve the minimization problem. Minimize C = 10x + y…
A: Objective Functions: Minimize C= 10 x+ y Constraints: Subject to- 4x+y≥24 (Constraint 1)…
Q: what type of investment strategy would be selected by the Equally Likelycriterion?
A: Equally likely: The Equally Likely rule assumes that either of the States of Nature might happen,…
Q: The table below shows information about the number of customers (in thousand) of a coffee shop per…
A: Find the Given details below: Given details: Year Quarters 1 2 3 4 2018 1.2 0.9 0.7 1.8…
Q: ABC company wants to open one, two, or three shops. The average Profit varies with the demand in…
A: Given Information:
Q: 1a. Use the graph below to write a linear model to approximate the population of Bangladesh. (Do not…
A: From the graph, the approximate values of the population are as follows.
Q: etermine the following: Plot these data and decide if a linear model is reasonable. Using the…
A: WE ARE GIVEN THE ANNUAL SALES TAX COLLECTIONS AND NEW CAR REGISTRATIONS. WE ARE ASKED TO PLOT THE…
Q: Ohio Swiss Milk Products manufactures and distributes ice cream in Ohio, Kentucky, and West…
A:
Q: A motion picture industry analyst is studying movies based on epic novels. The following data were…
A: Regression analysis is a type of prescient displaying method which explores the connection between a…
Q: The Bluegrass Distillery produces custom-blended whiskey. A particular blend consists of rye and…
A: a) Following is that the formulation of the above problem Let x = Rye and y = Bourbon Objective -…
Q: What are the possible factors that could be responsible for food not being available at the right…
A: It is quite significant for the food to provide proper utility for it to reach at right place and be…
Q: The director of cooperative education at a state college wants to examine the effect of cooperative…
A: Learning method is an organized approach of integrating school environment instruction with an on…
Q: 1. Sara is planning to start a new designer cloth shop. Her problem is to decide how large her shop…
A: Answer: For this question, we can reach the solution with the help of decision making without…
Q: Beeson Co. is experiencing a decrease in sales and operating income for the fiscal year ending…
A: According to the measure of sales recorded, Julia is performing her job. To that extent in which…
Q: ABC company wants to open one, two, or three shops. The average Profit varies with the demand in…
A: Concepts used to solve the problem: MAXIMAX: Determine the best possible payoff, and choose the…
Q: Trent Berton is in charge of marketing for the family business, Berton's Burgers. Todd is in charge…
A: Please find the attached answer of both the questions based on the case-study given-
Q: As we saw in Figure 3.5, one way to show convexity of indifference curves is to show that, for any…
A: a). A function is said to be convex when the averages are preferred over extremes. For utility…
Q: Given these values, what type of investment strategy would be selected by the Maximincriterion?
A: Maximin: The implementation is done by taking minimum of all values first and then taking the…
Q: Maximus Steel plans to introduce one of three new products code-named: Wren, Hawk, and Nightingale.…
A: 1.
Q: health group wants to identify consumers who: once went to a competing primary care group but left…
A: The health care company's healthcare system the day that care he or she provides. Normally, this…


Trending now
This is a popular solution!

Step by step
Solved in 3 steps with 2 images


- The eTech Company is a fairly recent entry in the electronic device area. The company competes with Apple. Samsung, and other well-known companies in the manufacturing and sales of personal handheld devices. Although eTech recognizes that it is a niche player and will likely remain so in the foreseeable future, it is trying to increase its current small market share in this huge competitive market. Jim Simons, VP of Production, and Catherine Dolans, VP of Marketing, have been discussing the possible addition of a new product to the companys current (rather limited) product line. The tentative name for this new product is ePlayerX. Jim and Catherine agree that the ePlayerX, which will feature a sleeker design and more memory, is necessary to compete successfully with the big boys, but they are also worried that the ePlayerX could cannibalize sales of their existing productsand that it could even detract from their bottom line. They must eventually decide how much to spend to develop and manufacture the ePlayerX and how aggressively to market it. Depending on these decisions, they must forecast demand for the ePlayerX, as well as sales for their existing products. They also realize that Apple. Samsung, and the other big players are not standing still. These competitors could introduce their own new products, which could have very negative effects on demand for the ePlayerX. The expected timeline for the ePlayerX is that development will take no more than a year to complete and that the product will be introduced in the market a year from now. Jim and Catherine are aware that there are lots of decisions to make and lots of uncertainties involved, but they need to start somewhere. To this end. Jim and Catherine have decided to base their decisions on a planning horizon of four years, including the development year. They realize that the personal handheld device market is very fluid, with updates to existing products occurring almost continuously. However, they believe they can include such considerations into their cost, revenue, and demand estimates, and that a four-year planning horizon makes sense. In addition, they have identified the following problem parameters. (In this first pass, all distinctions are binary: low-end or high-end, small-effect or large-effect, and so on.) In the absence of cannibalization, the sales of existing eTech products are expected to produce year I net revenues of 10 million, and the forecast of the annual increase in net revenues is 2%. The ePIayerX will be developed as either a low-end or a high-end product, with corresponding fixed development costs (1.5 million or 2.5 million), variable manufacturing costs ( 100 or 200). and selling prices (150 or 300). The fixed development cost is incurred now, at the beginning of year I, and the variable cost and selling price are assumed to remain constant throughout the planning horizon. The new product will be marketed either mildly aggressively or very aggressively, with corresponding costs. The costs of a mildly aggressive marketing campaign are 1.5 million in year 1 and 0.5 million annually in years 2 to 4. For a very aggressive campaign, these costs increase to 3.5 million and 1.5 million, respectively. (These marketing costs are not part of the variable cost mentioned in the previous bullet; they are separate.) Depending on whether the ePlayerX is a low-end or high-end produce the level of the ePlayerXs cannibalization rate of existing eTech products will be either low (10%) or high (20%). Each cannibalization rate affects only sales of existing products in years 2 to 4, not year I sales. For example, if the cannibalization rate is 10%, then sales of existing products in each of years 2 to 4 will be 10% below their projected values without cannibalization. A base case forecast of demand for the ePlayerX is that in its first year on the market, year 2, demand will be for 100,000 units, and then demand will increase by 5% annually in years 3 and 4. This base forecast is based on a low-end version of the ePlayerX and mildly aggressive marketing. It will be adjusted for a high-end will product, aggressive marketing, and competitor behavior. The adjustments with no competing product appear in Table 2.3. The adjustments with a competing product appear in Table 2.4. Each adjustment is to demand for the ePlayerX in each of years 2 to 4. For example, if the adjustment is 10%, then demand in each of years 2 to 4 will be 10% lower than it would have been in the base case. Demand and units sold are the samethat is, eTech will produce exactly what its customers demand so that no inventory or backorders will occur. Table 2.3 Demand Adjustments When No Competing Product Is Introduced Table 2.4 Demand Adjustments When a Competing Product Is Introduced Because Jim and Catherine are approaching the day when they will be sharing their plans with other company executives, they have asked you to prepare an Excel spreadsheet model that will answer the many what-if questions they expect to be asked. Specifically, they have asked you to do the following: You should enter all of the given data in an inputs section with clear labeling and appropriate number formatting. If you believe that any explanations are required, you can enter them in text boxes or cell comments. In this section and in the rest of the model, all monetary values (other than the variable cost and the selling price) should be expressed in millions of dollars, and all demands for the ePlayerX should be expressed in thousands of units. You should have a scenario section that contains a 0/1 variable for each of the binary options discussed here. For example, one of these should be 0 if the low-end product is chosen and it should be 1 if the high-end product is chosen. You should have a parameters section that contains the values of the various parameters listed in the case, depending on the values of the 0/1 variables in the previous bullet For example, the fixed development cost will be 1.5 million or 2.5 million depending on whether the 0/1 variable in the previous bullet is 0 or 1, and this can be calculated with a simple IF formula. You can decide how to implement the IF logic for the various parameters. You should have a cash flows section that calculates the annual cash flows for the four-year period. These cash flows include the net revenues from existing products, the marketing costs for ePlayerX, and the net revenues for sales of ePlayerX (To calculate these latter values, it will help to have a row for annual units sold of ePlayerX.) The cash flows should also include depreciation on the fixed development cost, calculated on a straight-line four-year basis (that is. 25% of the cost in each of the four years). Then, these annual revenues/costs should be summed for each year to get net cash flow before taxes, taxes should be calculated using a 32% tax rate, and taxes should be subtracted and depreciation should be added back in to get net cash flows after taxes. (The point is that depreciation is first subtracted, because it is not taxed, but then it is added back in after taxes have been calculated.) You should calculate the company's NPV for the four-year horizon using a discount rate of 10%. You can assume that the fixed development cost is incurred now. so that it is not discounted, and that all other costs and revenues are incurred at the ends of the respective years. You should accompany all of this with a line chart with three series: annual net revenues from existing products; annual marketing costs for ePlayerX; and annual net revenues from sales of ePlayerX. Once all of this is completed. Jim and Catherine will have a powerful tool for presentation purposes. By adjusting the 0/1 scenario variables, their audience will be able to see immediately, both numerically and graphically, the financial consequences of various scenarios.Suppose that GLC earns a 2000 profit each time a person buys a car. We want to determine how the expected profit earned from a customer depends on the quality of GLCs cars. We assume a typical customer will purchase 10 cars during her lifetime. She will purchase a car now (year 1) and then purchase a car every five yearsduring year 6, year 11, and so on. For simplicity, we assume that Hundo is GLCs only competitor. We also assume that if the consumer is satisfied with the car she purchases, she will buy her next car from the same company, but if she is not satisfied, she will buy her next car from the other company. Hundo produces cars that satisfy 80% of its customers. Currently, GLC produces cars that also satisfy 80% of its customers. Consider a customer whose first car is a GLC car. If profits are discounted at 10% annually, use simulation to estimate the value of this customer to GLC. Also estimate the value of a customer to GLC if it can raise its customer satisfaction rating to 85%, to 90%, or to 95%. You can interpret the satisfaction value as the probability that a customer will not switch companies.An automobile manufacturer is considering whether to introduce a new model called the Racer. The profitability of the Racer depends on the following factors: The fixed cost of developing the Racer is triangularly distributed with parameters 3, 4, and 5, all in billions. Year 1 sales are normally distributed with mean 200,000 and standard deviation 50,000. Year 2 sales are normally distributed with mean equal to actual year 1 sales and standard deviation 50,000. Year 3 sales are normally distributed with mean equal to actual year 2 sales and standard deviation 50,000. The selling price in year 1 is 25,000. The year 2 selling price will be 1.05[year 1 price + 50 (% diff1)] where % diff1 is the number of percentage points by which actual year 1 sales differ from expected year 1 sales. The 1.05 factor accounts for inflation. For example, if the year 1 sales figure is 180,000, which is 10 percentage points below the expected year 1 sales, then the year 2 price will be 1.05[25,000 + 50( 10)] = 25,725. Similarly, the year 3 price will be 1.05[year 2 price + 50(% diff2)] where % diff2 is the percentage by which actual year 2 sales differ from expected year 2 sales. The variable cost in year 1 is triangularly distributed with parameters 10,000, 12,000, and 15,000, and it is assumed to increase by 5% each year. Your goal is to estimate the NPV of the new car during its first three years. Assume that the company is able to produce exactly as many cars as it can sell. Also, assume that cash flows are discounted at 10%. Simulate 1000 trials to estimate the mean and standard deviation of the NPV for the first three years of sales. Also, determine an interval such that you are 95% certain that the NPV of the Racer during its first three years of operation will be within this interval.
- Seas Beginning sells clothing by mail order. An important question is when to strike a customer from the companys mailing list. At present, the company strikes a customer from its mailing list if a customer fails to order from six consecutive catalogs. The company wants to know whether striking a customer from its list after a customer fails to order from four consecutive catalogs results in a higher profit per customer. The following data are available: If a customer placed an order the last time she received a catalog, then there is a 20% chance she will order from the next catalog. If a customer last placed an order one catalog ago, there is a 16% chance she will order from the next catalog she receives. If a customer last placed an order two catalogs ago, there is a 12% chance she will order from the next catalog she receives. If a customer last placed an order three catalogs ago, there is an 8% chance she will order from the next catalog she receives. If a customer last placed an order four catalogs ago, there is a 4% chance she will order from the next catalog she receives. If a customer last placed an order five catalogs ago, there is a 2% chance she will order from the next catalog she receives. It costs 2 to send a catalog, and the average profit per order is 30. Assume a customer has just placed an order. To maximize expected profit per customer, would Seas Beginning make more money canceling such a customer after six nonorders or four nonorders?You want to take out a 450,000 loan on a 20-year mortgage with end-of-month payments. The annual rate of interest is 3%. Twenty years from now, you will need to make a 50,000 ending balloon payment. Because you expect your income to increase, you want to structure the loan so at the beginning of each year, your monthly payments increase by 2%. a. Determine the amount of each years monthly payment. You should use a lookup table to look up each years monthly payment and to look up the year based on the month (e.g., month 13 is year 2, etc.). b. Suppose payment each month is to be the same, and there is no balloon payment. Show that the monthly payment you can calculate from your spreadsheet matches the value given by the Excel PMT function PMT(0.03/12,240, 450000,0,0).Based on Babich (1992). Suppose that each week each of 300 families buys a gallon of orange juice from company A, B, or C. Let pA denote the probability that a gallon produced by company A is of unsatisfactory quality, and define pB and pC similarly for companies B and C. If the last gallon of juice purchased by a family is satisfactory, the next week they will purchase a gallon of juice from the same company. If the last gallon of juice purchased by a family is not satisfactory, the family will purchase a gallon from a competitor. Consider a week in which A families have purchased juice A, B families have purchased juice B, and C families have purchased juice C. Assume that families that switch brands during a period are allocated to the remaining brands in a manner that is proportional to the current market shares of the other brands. For example, if a customer switches from brand A, there is probability B/(B + C) that he will switch to brand B and probability C/(B + C) that he will switch to brand C. Suppose that the market is currently divided equally: 10,000 families for each of the three brands. a. After a year, what will the market share for each firm be? Assume pA = 0.10, pB = 0.15, and pC = 0.20. (Hint: You will need to use the RISKBINOMLAL function to see how many people switch from A and then use the RISKBENOMIAL function again to see how many switch from A to B and from A to C. However, if your model requires more RISKBINOMIAL functions than the number allowed in the academic version of @RISK, remember that you can instead use the BENOM.INV (or the old CRITBENOM) function to generate binomially distributed random numbers. This takes the form =BINOM.INV (ntrials, psuccess, RAND()).) b. Suppose a 1% increase in market share is worth 10,000 per week to company A. Company A believes that for a cost of 1 million per year it can cut the percentage of unsatisfactory juice cartons in half. Is this worthwhile? (Use the same values of pA, pB, and pC as in part a.)