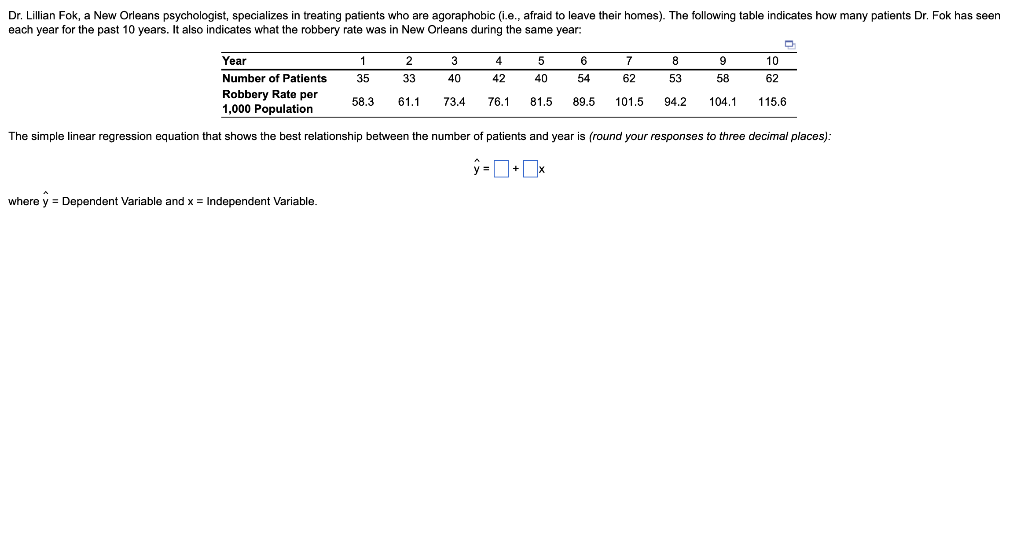
Dr. Lillian Fok, a New Orleans psychologist, specializes in treating patients who are agoraphobic (i.e., afraid to leave their homes). The following table indicates how many patients Dr. Fok has se each year for the past 10 years. It also indicates what the robbery rate was in New Orleans during the same year: Year Number of Patients Robbery Rate per 1,000 Population The simple linear regression equation that shows the best relationship between the number where y Dependent Variable and x = Independent Variable. 1 35 58.3 61.1 73.4 2 33 3 40 6 8 54 53 76.1 81.5 89.5 101.5 94.2 4 42 5 40 7 62 patients and year is (round your responses ŷ-+x 9 58 104.1 D 10 62 115.6 three decimal places):


Q: Why is franchising a popular way to expand distribution of an effective service concept? What are…
A: Franchising can be stated as the form of distribution and marketing in which the business owner…
Q: List the tool of quality in operation management
A: Operation management is performed in each manufacturing organization. It all deals with the…
Q: Explain what an emergency is in humanitarian logistics? What are the causes of emergencies in…
A: Humanitarian logistics is a branch of logistics that takes care of delivering and warehousing the…
Q: You have a new job as a Financial Planning assistant. Your client wants to invest money in stocks,…
A: Objective Functions and Constraints (Scenario 2): Based on the given details, the…
Q: The City Commission of Nashville has decided to build a botanical garden and picnic area in the…
A: Precedence table-
Q: discuss the role of intermodal transportation in the case above
A: The level of traffic at the Port of Walvis Bay & along its transportation corridors has…
Q: a. Develop, for each department and day, the capacity requirements for each product and the total…
A: Scheduling is the process of arranging production activities in order to complete the manufacturing…
Q: Describe and discuss the application of innovation and Industry 4.0 in maintenance works i.e.,…
A: This term refers to the fourth industrial revolution that we are experiencing at present. It…
Q: you are in charge of analyzing five new suppliers of an important raw material and have been given…
A: Lets Criteria be x Criteria 2 and 3 are equally important = x Criteria 1 and 4 are 4 times as…
Q: The Copperfield Mining Company owns two mines,which produce three grades of ore: high, medium,…
A: Decision Variable: Suppose-x1 be the no. of hours to operate the mine-1x2 be the no. of hours to…
Q: Provide at least five project stakeholders as well as the role they play in the Construction…
A: The word stakeholders is often used to refer to those who care about the success of a project or…
Q: emand for the planning horizon. The plan must deal with highly seasonal demand; demand is relatively…
A: Ans) Formula:
Q: 4
A: In the decision tree, An expected value is acquired by multiplying the value of each possible…
Q: QUESTION 1: A confectioner buys plastic boxes in bulk and uses them to pack chocolates. The annual…
A: Annual demand(D) = 1200 Cost = 30 Holding cost(H) = 20%*30 = 6 Ordering cost(O) = 10 Calculate…
Q: Mark has just been fired as the college bookstore manager for setting prices too low (only 20…
A: Given data is Profit by small if the demand is good = P50,000 Loss by small if the demand is low =…
Q: Describe the operations function and the nature of the operations manager's job. NOTE: please refer…
A: the operations consist of different activities which can be of the following types - producing goods…
Q: a. Calculate ALL the missing (?) data points. b. Draw the PERT network from the given data. c.…
A: Critical path is the longest of all the paths.
Q: preparation process.
A: The ‘Production Preparation Process’ is a powerful way of taking a big-picture glimpse at how a…
Q: W = jars of Western Foods Salsa M = jars of Mexico City Salsa leads to the formulation (units for…
A: As per Bartleby guidelines, we can only solve the first three subparts of one question at a…
Q: Calculate the ES, EF, LS, and LF times and the slack for each activity in the figure below, and…
A: A network diagram related to the project shows the sequence of the task that is performed to…
Q: 140 Friday Using this table above, solve for Mean Absolute Deviation (MAD) xample 9.6568->9.66
A: Absolute error = |actual-forecast| MAD = Average |actual-forecast|
Q: What is your definition of geographic information systems (GIS)?
A: A geographic information system (GIS) gathers, arranges, manipulates, and maps different types of…
Q: Sales of tablet computers at Ted Glickman's electronics store in Washington, D.C., over the past 10…
A: The average of absolute deviations from the data set's center is the average absolute deviation of…
Q: Brown's, a local bakery, is worried about increased costs particularly energy. Last year's records…
A: Given: Production Last year = U1 = 1500 Energy required last year = B1 = 3000 BTU Production now =…
Q: 1. Explain the meaning of the expected value of perfect information (EVPI) in this problem. Based on…
A: Since you have posted a question with multiple sub-parts, we will solve first three sub-parts for…
Q: What is the importance of integration in Humanitarian Supply Chain operational processes (Making use…
A: Humanitarian Supply Chain Management:- In the immediate aftermath of any of disaster or…
Q: Dave Fletcher was able to determine the activity times for constructing his laser scanning machine.…
A: 1. During forward pass in case of more than two preceding activities the early start will be…
Q: Lenovo uses the ZX-81 chip in some of its laptop computers. The prices for the chip during the last…
A: 2 month moving average is a forecasting model which considering forecast as the average value of…
Q: George Kyparisis owns a company that manufactures sailboats. Actual demand for George's sailboats…
A: Solution
Q: 3.8 Given the following data, calculate how many units are available to promise. There are zero…
A: Week 1 2 3 4 5 6 Customer order 21 0 17 8 0 3 Inventory on hand 0 MPS 30 0…
Q: Q2: Consider a process consisting of three resources: Resource 1 2 3 Processing Time (min/unit)…
A: Bottleneck: The process step (station) in the flow diagram with the lowest capacity is referred to…
Q: Namibia: Walvis Bay Port is now a regional logistic hub The new container terminal at the Namibian…
A: Common core components of Transport: A transport system has the following core…
Q: The monthly sales for Yazici Batteries, Inc., were as follows:…
A: A naive method is a forecasting approach in which the previous month's actual data is employed as…
Q: Calculate (a) MAD and (b) MSE for the following forecast versus actual sales figures:…
A: ABSOLUTE ERROR = |ACTUAL-FORECAST| MAD = AVERAGE(ABSOLUTE ERROR) MSE = AVERAGE(ERROR^2)
Q: Q-The company has kept at one of its plants 24 months records of the total number of failures…
A: Given data-
Q: 4. Jim Bildery's factory is considering three approaches for meeting an expected increase in demand.…
A: The expected value of perfect information is the price that one would be willing to pay in order to…
Q: George Kyparisis makes bowling balls in his Miami plant. With recent increases in his costs, he has…
A: Given: Units produced last year = U1 = 1000 Labor hours required last year = H1 = 300 Units produced…
Q: a. Calculate ALL the missing (?) data points. b. Draw the PERT network from the given data. c.…
A: NOTE: We are allowed to do the first three sub-parts only. PERT is a project management tool used…
Q: two different manufacturing processes are being considered for making a new product. the first…
A: Fixed cost = 50,000 Variable cost = 700 For process 1 equation is Let assume number of unit = x…
Q: Round Tree Manor is a hotel that provides two types of rooms with three rental classes: Super Saver,…
A: Let, X1S = Reservations to be accepted for type 1 room and super saver rental class X1D =…
Q: Digicel’s cell phone sales over the last four months are as follows: January = 100 February = 120…
A: Naïve forecast is a method of estimation that uses previous period's actuals as the prediction for…
Q: question one Using cocaccola as an organization of your choice, discuss the relationship between…
A: Production management:- Planning, organising, and redesigning the production process for goods or…
Q: The manager of a park hotel is considering how to restructure the front desk to reach an optimum…
A: Find the Given details below: Given details: Arrival time 90 guests per hour Service time 3…
Q: A mortgage service office has the following four activities involved in approving a loan…
A: Capacity indicating the maximum possible production unit based on the 1005 usage in a specific…
Q: You work for the Brad's Nailer Company which manufactures three types of nailers: a pneumatic model,…
A: From the given information, there are three types of nailers, Pneumatic, ProLine and Cordless.…
Q: 4) A 12-ounce box of Greenies costs $12.99. A 30-ounce box costs $26.99. (a) What is the cost in…
A: “Since you have posted a question with multiple sub-parts, we will solve the first three sub-parts…
Q: a) Choose the correct project network. OA Start Start b) The critical path is S-U-W-Y The project…
A:
Q: A manufacturer of Protex soap must determine whether or not to expand his productive capacity. His…
A: Find the Given details below: Given details: Do not Expand Expand High Demand 5000 7500…
Q: Need Answers for questions D,E, and F ONLY
A: Given data is
Q: Describe how to conduct a customer and team post-project review.
A: Post- project reviews:- Post-project reviews are an important part of the overall project management…

Step by step
Solved in 3 steps with 2 images

- Suppose that a regional express delivery service company wants to estimate the cost of shipping a package (Y) as a function of cargo type, where cargo type includes the following possibilities: fragile, semifragile, and durable. Costs for 15 randomly chosen packages of approximately the same weight and same distance shipped, but of different cargo types, are provided in the file P13_16.xlsx. a. Estimate a regression equation using the given sample data, and interpret the estimated regression coefficients. b. According to the estimated regression equation, which cargo type is the most costly to ship? Which cargo type is the least costly to ship? c. How well does the estimated equation fit the given sample data? How might the fit be improved? d. Given the estimated regression equation, predict the cost of shipping a package with semifragile cargo.The owner of a restaurant in Bloomington, Indiana, has recorded sales data for the past 19 years. He has also recorded data on potentially relevant variables. The data are listed in the file P13_17.xlsx. a. Estimate a simple regression equation involving annual sales (the dependent variable) and the size of the population residing within 10 miles of the restaurant (the explanatory variable). Interpret R-square for this regression. b. Add another explanatory variableannual advertising expendituresto the regression equation in part a. Estimate and interpret this expanded equation. How does the R-square value for this multiple regression equation compare to that of the simple regression equation estimated in part a? Explain any difference between the two R-square values. How can you use the adjusted R-squares for a comparison of the two equations? c. Add one more explanatory variable to the multiple regression equation estimated in part b. In particular, estimate and interpret the coefficients of a multiple regression equation that includes the previous years advertising expenditure. How does the inclusion of this third explanatory variable affect the R-square, compared to the corresponding values for the equation of part b? Explain any changes in this value. What does the adjusted R-square for the new equation tell you?The Baker Company wants to develop a budget to predict how overhead costs vary with activity levels. Management is trying to decide whether direct labor hours (DLH) or units produced is the better measure of activity for the firm. Monthly data for the preceding 24 months appear in the file P13_40.xlsx. Use regression analysis to determine which measure, DLH or Units (or both), should be used for the budget. How would the regression equation be used to obtain the budget for the firms overhead costs?
- The management of a technology company is trying to determine the variable that best explains the variation of employee salaries using a sample of 52 full-time employees; see the file P13_08.xlsx. Estimate simple linear regression equations to identify which of the following has the strongest linear relationship with annual salary: the employees gender, age, number of years of relevant work experience prior to employment at the company, number of years of employment at the company, or number of years of post secondary education. Provide support for your conclusion.An automobile manufacturer is considering whether to introduce a new model called the Racer. The profitability of the Racer depends on the following factors: The fixed cost of developing the Racer is triangularly distributed with parameters 3, 4, and 5, all in billions. Year 1 sales are normally distributed with mean 200,000 and standard deviation 50,000. Year 2 sales are normally distributed with mean equal to actual year 1 sales and standard deviation 50,000. Year 3 sales are normally distributed with mean equal to actual year 2 sales and standard deviation 50,000. The selling price in year 1 is 25,000. The year 2 selling price will be 1.05[year 1 price + 50 (% diff1)] where % diff1 is the number of percentage points by which actual year 1 sales differ from expected year 1 sales. The 1.05 factor accounts for inflation. For example, if the year 1 sales figure is 180,000, which is 10 percentage points below the expected year 1 sales, then the year 2 price will be 1.05[25,000 + 50( 10)] = 25,725. Similarly, the year 3 price will be 1.05[year 2 price + 50(% diff2)] where % diff2 is the percentage by which actual year 2 sales differ from expected year 2 sales. The variable cost in year 1 is triangularly distributed with parameters 10,000, 12,000, and 15,000, and it is assumed to increase by 5% each year. Your goal is to estimate the NPV of the new car during its first three years. Assume that the company is able to produce exactly as many cars as it can sell. Also, assume that cash flows are discounted at 10%. Simulate 1000 trials to estimate the mean and standard deviation of the NPV for the first three years of sales. Also, determine an interval such that you are 95% certain that the NPV of the Racer during its first three years of operation will be within this interval.A small computer chip manufacturer wants to forecast monthly ozperating costs as a function of the number of units produced during a month. The company has collected the 16 months of data in the file P13_34.xlsx. a. Determine an equation that can be used to predict monthly production costs from units produced. Are there any outliers? b. How could the regression line obtained in part a be used to determine whether the company was efficient or inefficient during any particular month?
- Play Things is developing a new Lady Gaga doll. The company has made the following assumptions: The doll will sell for a random number of years from 1 to 10. Each of these 10 possibilities is equally likely. At the beginning of year 1, the potential market for the doll is two million. The potential market grows by an average of 4% per year. The company is 95% sure that the growth in the potential market during any year will be between 2.5% and 5.5%. It uses a normal distribution to model this. The company believes its share of the potential market during year 1 will be at worst 30%, most likely 50%, and at best 60%. It uses a triangular distribution to model this. The variable cost of producing a doll during year 1 has a triangular distribution with parameters 15, 17, and 20. The current selling price is 45. Each year, the variable cost of producing the doll will increase by an amount that is triangularly distributed with parameters 2.5%, 3%, and 3.5%. You can assume that once this change is generated, it will be the same for each year. You can also assume that the company will change its selling price by the same percentage each year. The fixed cost of developing the doll (which is incurred right away, at time 0) has a triangular distribution with parameters 5 million, 7.5 million, and 12 million. Right now there is one competitor in the market. During each year that begins with four or fewer competitors, there is a 25% chance that a new competitor will enter the market. Year t sales (for t 1) are determined as follows. Suppose that at the end of year t 1, n competitors are present (including Play Things). Then during year t, a fraction 0.9 0.1n of the company's loyal customers (last year's purchasers) will buy a doll from Play Things this year, and a fraction 0.2 0.04n of customers currently in the market ho did not purchase a doll last year will purchase a doll from Play Things this year. Adding these two provides the mean sales for this year. Then the actual sales this year is normally distributed with this mean and standard deviation equal to 7.5% of the mean. a. Use @RISK to estimate the expected NPV of this project. b. Use the percentiles in @ RISKs output to find an interval such that you are 95% certain that the companys actual NPV will be within this interval.Seas Beginning sells clothing by mail order. An important question is when to strike a customer from the companys mailing list. At present, the company strikes a customer from its mailing list if a customer fails to order from six consecutive catalogs. The company wants to know whether striking a customer from its list after a customer fails to order from four consecutive catalogs results in a higher profit per customer. The following data are available: If a customer placed an order the last time she received a catalog, then there is a 20% chance she will order from the next catalog. If a customer last placed an order one catalog ago, there is a 16% chance she will order from the next catalog she receives. If a customer last placed an order two catalogs ago, there is a 12% chance she will order from the next catalog she receives. If a customer last placed an order three catalogs ago, there is an 8% chance she will order from the next catalog she receives. If a customer last placed an order four catalogs ago, there is a 4% chance she will order from the next catalog she receives. If a customer last placed an order five catalogs ago, there is a 2% chance she will order from the next catalog she receives. It costs 2 to send a catalog, and the average profit per order is 30. Assume a customer has just placed an order. To maximize expected profit per customer, would Seas Beginning make more money canceling such a customer after six nonorders or four nonorders?A company manufacturers a product in the United States and sells it in England. The unit cost of manufacturing is 50. The current exchange rate (dollars per pound) is 1.221. The demand function, which indicates how many units the company can sell in England as a function of price (in pounds) is of the power type, with constant 27556759 and exponent 2.4. a. Develop a model for the companys profit (in dollars) as a function of the price it charges (in pounds). Then use a data table to find the profit-maximizing price to the nearest pound. b. If the exchange rate varies from its current value, does the profit-maximizing price increase or decrease? Does the maximum profit increase or decrease?
- Based on Babich (1992). Suppose that each week each of 300 families buys a gallon of orange juice from company A, B, or C. Let pA denote the probability that a gallon produced by company A is of unsatisfactory quality, and define pB and pC similarly for companies B and C. If the last gallon of juice purchased by a family is satisfactory, the next week they will purchase a gallon of juice from the same company. If the last gallon of juice purchased by a family is not satisfactory, the family will purchase a gallon from a competitor. Consider a week in which A families have purchased juice A, B families have purchased juice B, and C families have purchased juice C. Assume that families that switch brands during a period are allocated to the remaining brands in a manner that is proportional to the current market shares of the other brands. For example, if a customer switches from brand A, there is probability B/(B + C) that he will switch to brand B and probability C/(B + C) that he will switch to brand C. Suppose that the market is currently divided equally: 10,000 families for each of the three brands. a. After a year, what will the market share for each firm be? Assume pA = 0.10, pB = 0.15, and pC = 0.20. (Hint: You will need to use the RISKBINOMLAL function to see how many people switch from A and then use the RISKBENOMIAL function again to see how many switch from A to B and from A to C. However, if your model requires more RISKBINOMIAL functions than the number allowed in the academic version of @RISK, remember that you can instead use the BENOM.INV (or the old CRITBENOM) function to generate binomially distributed random numbers. This takes the form =BINOM.INV (ntrials, psuccess, RAND()).) b. Suppose a 1% increase in market share is worth 10,000 per week to company A. Company A believes that for a cost of 1 million per year it can cut the percentage of unsatisfactory juice cartons in half. Is this worthwhile? (Use the same values of pA, pB, and pC as in part a.)It costs a pharmaceutical company 75,000 to produce a 1000-pound batch of a drug. The average yield from a batch is unknown but the best case is 90% yield (that is, 900 pounds of good drug will be produced), the most likely case is 85% yield, and the worst case is 70% yield. The annual demand for the drug is unknown, with the best case being 20,000 pounds, the most likely case 17,500 pounds, and the worst case 10,000 pounds. The drug sells for 125 per pound and leftover amounts of the drug can be sold for 30 per pound. To maximize annual expected profit, how many batches of the drug should the company produce? You can assume that it will produce the batches only once, before demand for the drug is known.Dr. Lillian Fok, a New Orleans psychologist, spe-cializes in treating patients who are agoraphobic (i.e., afraid to leave their homes). The following table indicates how manypatients Dr. Fok has seen each year for the past 10 years. It alsoindicates what the robbery rate was in New Orleans during thesame year: Using trend (linear regression) analysis, predict the number ofpatients Dr. Fok will see in years 11 and 12 as a function of time.How well does the model fit the data?
