Draw the mean and range charts from the following data and state your conclusion. Sample No. 1 3 4 5 6 7 8 9 10 Total Sample Mean 12.8 13.1 13.5 12.9 13.2 14.1 12.1 15.5 13.9| 14.2 |135.3 Sample Range 2.1 3.1 3.9 2.1 1.9 3.0 2.5 2.8 2.5 2.0 25.9 (Given n=5, A2=0.577, D3=0 D4=2.115) %3D
Draw the mean and range charts from the following data and state your conclusion. Sample No. 1 3 4 5 6 7 8 9 10 Total Sample Mean 12.8 13.1 13.5 12.9 13.2 14.1 12.1 15.5 13.9| 14.2 |135.3 Sample Range 2.1 3.1 3.9 2.1 1.9 3.0 2.5 2.8 2.5 2.0 25.9 (Given n=5, A2=0.577, D3=0 D4=2.115) %3D

Glencoe Algebra 1, Student Edition, 9780079039897, 0079039898, 2018
18th Edition
ISBN:9780079039897
Author:Carter
Publisher:Carter
Chapter10: Statistics
Section10.5: Comparing Sets Of Data
Problem 1GP

Related questions
Question
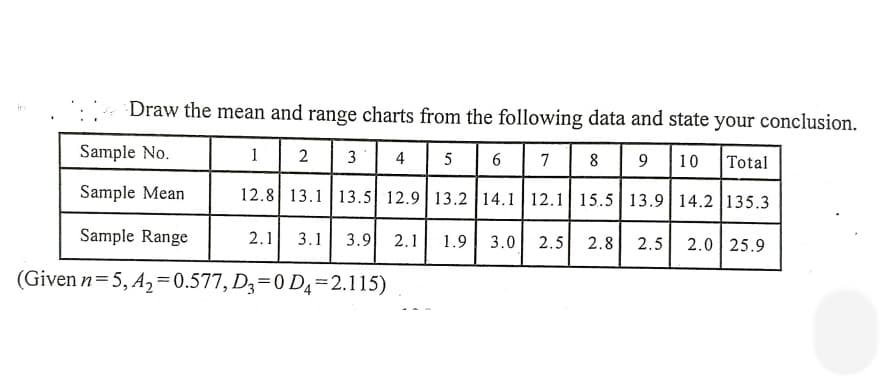
Transcribed Image Text:Draw the mean and range charts from the following data and state your conclusion.
ir
Sample No.
1
2
3
4
5
7
8
9
10
Total
Sample Mean
12.8 13.1 13.5 12.9 | 13.2 14.1 12.1 15.5 13.9| 14.2 |135.3
Sample Range
2.1
3.1
3.9
2.1
1.9
3.0
2.8
2.0 25.9
2.5
2.5
(Given n=5, A2=0.577, D3=0 D4=2.115)
Expert Solution
This question has been solved!
Explore an expertly crafted, step-by-step solution for a thorough understanding of key concepts.

Step by step
Solved in 3 steps with 3 images

Recommended textbooks for you
Glencoe Algebra 1, Student Edition, 9780079039897…
Algebra
ISBN:
9780079039897
Author:
Carter
Publisher:
McGraw Hill
Glencoe Algebra 1, Student Edition, 9780079039897…
Algebra
ISBN:
9780079039897
Author:
Carter
Publisher:
McGraw Hill