1. Question 1: The Public Utility Commission is interested in describing the relationship between household monthly utility bills and the size of the house. A recent study of 30 randomly selected household resulted in the following regression results: SUMMARY OUTPUT Regression Statistics Multiple R R Square Adjusted R Square Standard Error Observations 0.149769088 0.02243078 -0.012482407 16.72762259 30 ANOVA df SS MS 179.7725274 179.7725 0.642473 7834.774007 279.8134 1 Regression Residual Total 28 29 8014.546534 Standard Eror 13.44691911 4.941135 3.26E-05 0.006560753 0.801544 0.429567 Coefficients t Stat P-value Intercept Square Feet 66.44304169 0.005258733 (a) Based on the information provided, indicate what, if any, conclusions can be reached about the relationship between utility bill and the size of the house in square feet. (b) Construct a 95% confidence interval for the true regression coefficient of Square Feet. How do you interpret this confidence interval? (c) What is the F-test? In view of the F-test reported in this table, is the model significant? Please give a reason.
1. Question 1: The Public Utility Commission is interested in describing the relationship between household monthly utility bills and the size of the house. A recent study of 30 randomly selected household resulted in the following regression results: SUMMARY OUTPUT Regression Statistics Multiple R R Square Adjusted R Square Standard Error Observations 0.149769088 0.02243078 -0.012482407 16.72762259 30 ANOVA df SS MS 179.7725274 179.7725 0.642473 7834.774007 279.8134 1 Regression Residual Total 28 29 8014.546534 Standard Eror 13.44691911 4.941135 3.26E-05 0.006560753 0.801544 0.429567 Coefficients t Stat P-value Intercept Square Feet 66.44304169 0.005258733 (a) Based on the information provided, indicate what, if any, conclusions can be reached about the relationship between utility bill and the size of the house in square feet. (b) Construct a 95% confidence interval for the true regression coefficient of Square Feet. How do you interpret this confidence interval? (c) What is the F-test? In view of the F-test reported in this table, is the model significant? Please give a reason.

College Algebra
7th Edition
ISBN:9781305115545
Author:James Stewart, Lothar Redlin, Saleem Watson
Publisher:James Stewart, Lothar Redlin, Saleem Watson
Chapter1: Equations And Graphs
Section: Chapter Questions
Problem 10T: Olympic Pole Vault The graph in Figure 7 indicates that in recent years the winning Olympic men’s...

Related questions
Question
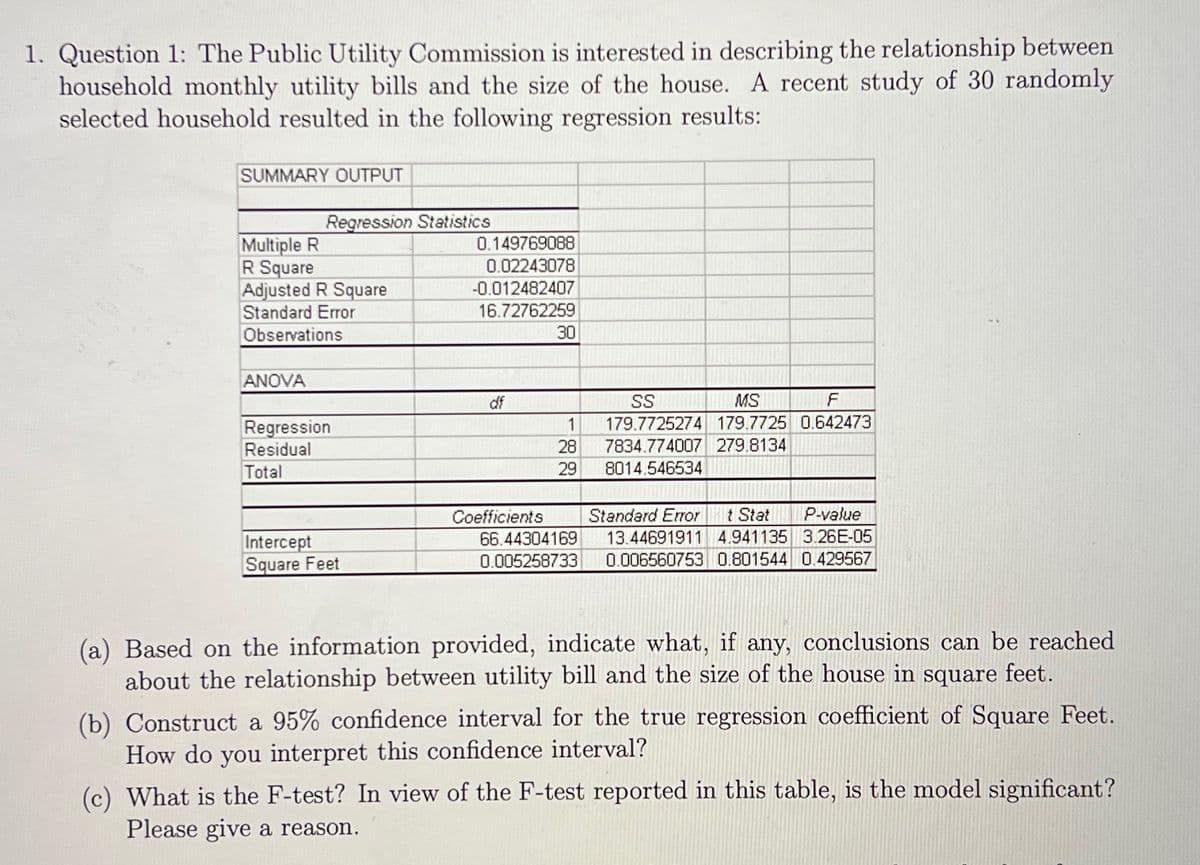
Transcribed Image Text:1. Question 1: The Public Utility Commission is interested in describing the relationship between
household monthly utility bills and the size of the house. A recent study of 30 randomly
selected household resulted in the following regression results:
SUMMARY OUTPUT
Regression Statistics
Multiple R
R Square
Adjusted R Square
Standard Error
0.149769088
0.02243078
-0.012482407
16.72762259
Observations
30
ANOVA
df
SS
MS
1
179.7725274 179.7725 0.642473
Regression
Residual
28
7834.774007 279.8134
Total
29
8014.546534
t Stat
13.44691911 4.941135 3.26E-05
0.006560753 0.801544 0.429567
P-value
Coefficients
66.44304169
0.005258733
Standard Eror
Intercept
Square Feet
(a) Based on the information provided, indicate what, if any, conclusions can be reached
about the relationship between utility bill and the size of the house in square feet.
(b) Construct a 95% confidence interval for the true regression coefficient of Square Feet.
How do you interpret this confidence interval?
(c) What is the F-test? In view of the F-test reported in this table, is the model significant?
Please give a reason.
Expert Solution
This question has been solved!
Explore an expertly crafted, step-by-step solution for a thorough understanding of key concepts.

Step by step
Solved in 3 steps with 3 images

Recommended textbooks for you
College Algebra
Algebra
ISBN:
9781305115545
Author:
James Stewart, Lothar Redlin, Saleem Watson
Publisher:
Cengage Learning

Linear Algebra: A Modern Introduction
Algebra
ISBN:
9781285463247
Author:
David Poole
Publisher:
Cengage Learning
College Algebra
Algebra
ISBN:
9781305115545
Author:
James Stewart, Lothar Redlin, Saleem Watson
Publisher:
Cengage Learning
Linear Algebra: A Modern Introduction
Algebra
ISBN:
9781285463247
Author:
David Poole
Publisher:
Cengage Learning