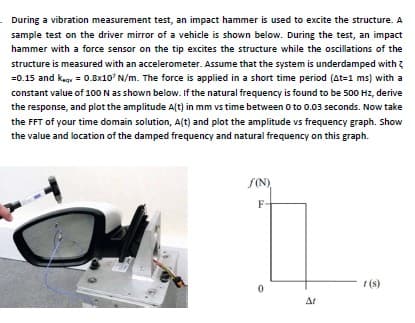
During a vibration measurement test, an impact hammer is used to excite the structure. A sample test on the driver mirror of a vehicle is shown below. During the test, an impact hammer with a force sensor on the tip excites the structure while the oscillations of the structure is measured with an accelerometer. Assume that the system is underdamped with =0.15 and K.q=0.8x10' N/m. The force is applied in a short time period (At=1 ms) with a constant value of 100 N as shown below. If the natural frequency is found to be 500 Hz, derive the response, and plot the amplitude A(t) in mm vs time between 0 to 0.03 seconds. Now take the FFT of your time domain solution, A(t) and plot the amplitude vs frequency graph. Show the value and location of the damped frequency and natural frequency on this graph.
During a vibration measurement test, an impact hammer is used to excite the structure. A sample test on the driver mirror of a vehicle is shown below. During the test, an impact hammer with a force sensor on the tip excites the structure while the oscillations of the structure is measured with an accelerometer. Assume that the system is underdamped with =0.15 and K.q=0.8x10' N/m. The force is applied in a short time period (At=1 ms) with a constant value of 100 N as shown below. If the natural frequency is found to be 500 Hz, derive the response, and plot the amplitude A(t) in mm vs time between 0 to 0.03 seconds. Now take the FFT of your time domain solution, A(t) and plot the amplitude vs frequency graph. Show the value and location of the damped frequency and natural frequency on this graph.

Elements Of Electromagnetics
7th Edition
ISBN:9780190698614
Author:Sadiku, Matthew N. O.
Publisher:Sadiku, Matthew N. O.
ChapterMA: Math Assessment
Section: Chapter Questions
Problem 1.1MA

Related questions
Question
100%
Transcribed Image Text:During a vibration measurement test, an impact hammer is used to excite the structure. A
sample test on the driver mirror of a vehicle is shown below. During the test, an impact
hammer with a force sensor on the tip excites the structure while the oscillations of the
structure is measured with an accelerometer. Assume that the system is underdamped with
=0.15 and keqv = 0.8x10' N/m. The force is applied in a short time period (At=1 ms) with a
constant value of 100 N as shown below. If the natural frequency is found to be 500 Hz, derive
the response, and plot the amplitude A(t) in mm vs time between 0 to 0.03 seconds. Now take
the FFT of your time domain solution, A(t) and plot the amplitude vs frequency graph. Show
the value and location of the damped frequency and natural frequency on this graph.
f(N)
F-
ΔΙ
t(s)
Expert Solution
This question has been solved!
Explore an expertly crafted, step-by-step solution for a thorough understanding of key concepts.

This is a popular solution!

Trending now
This is a popular solution!

Step by step
Solved in 4 steps with 3 images

Recommended textbooks for you
Elements Of Electromagnetics
Mechanical Engineering
ISBN:
9780190698614
Author:
Sadiku, Matthew N. O.
Publisher:
Oxford University Press

Mechanics of Materials (10th Edition)
Mechanical Engineering
ISBN:
9780134319650
Author:
Russell C. Hibbeler
Publisher:
PEARSON

Thermodynamics: An Engineering Approach
Mechanical Engineering
ISBN:
9781259822674
Author:
Yunus A. Cengel Dr., Michael A. Boles
Publisher:
McGraw-Hill Education
Elements Of Electromagnetics
Mechanical Engineering
ISBN:
9780190698614
Author:
Sadiku, Matthew N. O.
Publisher:
Oxford University Press
Mechanics of Materials (10th Edition)
Mechanical Engineering
ISBN:
9780134319650
Author:
Russell C. Hibbeler
Publisher:
PEARSON
Thermodynamics: An Engineering Approach
Mechanical Engineering
ISBN:
9781259822674
Author:
Yunus A. Cengel Dr., Michael A. Boles
Publisher:
McGraw-Hill Education

Control Systems Engineering
Mechanical Engineering
ISBN:
9781118170519
Author:
Norman S. Nise
Publisher:
WILEY

Mechanics of Materials (MindTap Course List)
Mechanical Engineering
ISBN:
9781337093347
Author:
Barry J. Goodno, James M. Gere
Publisher:
Cengage Learning

Engineering Mechanics: Statics
Mechanical Engineering
ISBN:
9781118807330
Author:
James L. Meriam, L. G. Kraige, J. N. Bolton
Publisher:
WILEY