During the 1990s the percentage of TV households viewing cable and satellite TV programs increased while the percentage viewing network affiliate shows (ABC, CBS, NBC, and FOX) generally decreased. The following table shows the primetime ratings for the network affiliates in the years 1993 and 1998. (In the table the rating percentage is defined as the percentage of TV households viewing a TV program in an average minute.)t Primetime Ratings for Network Affiliates x (year) y (rating percentage) 1993 40.2 1998 31.4 (a) Find the equation of the linear function whose graph passes through the two (x, y) points given in the table. (Round terms to two decimal places.) y = (b) Use a graphing utility to graph the line in part (a). Then use a TRACE or ZOOM feature to estimate what the rating percentage might have been for the year 2008. (Round your answer to one decimal place.) % (c) Compute the percentage error in the estimate in part (b), given that the actual figure for 2008, according to Nielsen Media Research, was 26.9. (Round your answer to one decimal place.) %
During the 1990s the percentage of TV households viewing cable and satellite TV programs increased while the percentage viewing network affiliate shows (ABC, CBS, NBC, and FOX) generally decreased. The following table shows the primetime ratings for the network affiliates in the years 1993 and 1998. (In the table the rating percentage is defined as the percentage of TV households viewing a TV program in an average minute.)t Primetime Ratings for Network Affiliates x (year) y (rating percentage) 1993 40.2 1998 31.4 (a) Find the equation of the linear function whose graph passes through the two (x, y) points given in the table. (Round terms to two decimal places.) y = (b) Use a graphing utility to graph the line in part (a). Then use a TRACE or ZOOM feature to estimate what the rating percentage might have been for the year 2008. (Round your answer to one decimal place.) % (c) Compute the percentage error in the estimate in part (b), given that the actual figure for 2008, according to Nielsen Media Research, was 26.9. (Round your answer to one decimal place.) %

Glencoe Algebra 1, Student Edition, 9780079039897, 0079039898, 2018
18th Edition
ISBN:9780079039897
Author:Carter
Publisher:Carter
Chapter4: Equations Of Linear Functions
Section4.4: Scatter Plots And Line Of Fit
Problem 1GP

Related questions

Question
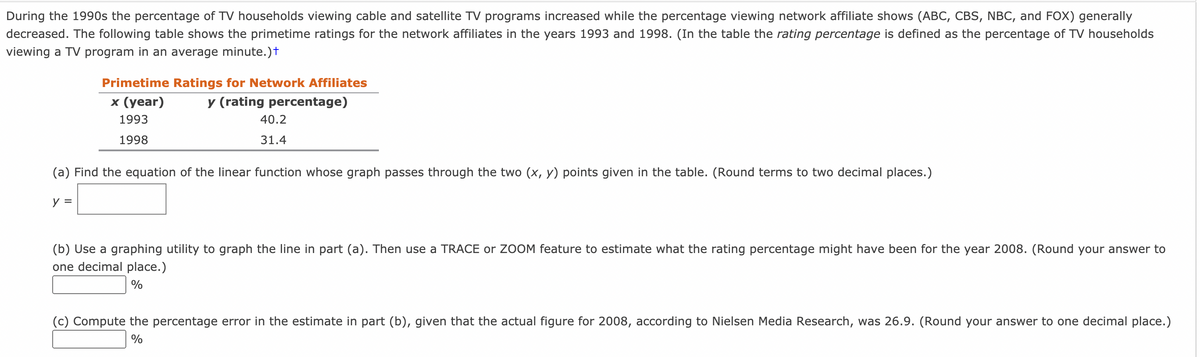
Transcribed Image Text:During the 1990s the percentage of TV households viewing cable and satellite TV programs increased while the percentage viewing network affiliate shows (ABC, CBS, NBC, and FOX) generally
decreased. The following table shows the primetime ratings for the network affiliates in the years 1993 and 1998. (In the table the rating percentage is defined as the percentage of TV households
viewing a TV program in an average minute.)†
Primetime Ratings for Network Affiliates
x (year)
y (rating percentage)
1993
40.2
1998
31.4
(a) Find the equation of the linear function whose graph passes through the two (x, y) points given in the table. (Round terms to two decimal places.)
y =
(b) Use a graphing utility to graph the line in part (a). Then use a TRACE or ZOOM feature to estimate what the rating percentage might have been for the year 2008. (Round your answer to
one decimal place.)
%
(c) Compute the percentage error in the estimate in part (b), given that the actual figure for 2008, according to Nielsen Media Research, was 26.9. (Round your answer to one decimal place.)
Expert Solution
This question has been solved!
Explore an expertly crafted, step-by-step solution for a thorough understanding of key concepts.

This is a popular solution!

Trending now
This is a popular solution!

Step by step
Solved in 4 steps with 1 images

Knowledge Booster


Learn more about
Need a deep-dive on the concept behind this application? Look no further. Learn more about this topic, calculus and related others by exploring similar questions and additional content below.Recommended textbooks for you
Glencoe Algebra 1, Student Edition, 9780079039897…
Algebra
ISBN:
9780079039897
Author:
Carter
Publisher:
McGraw Hill

Functions and Change: A Modeling Approach to Coll…
Algebra
ISBN:
9781337111348
Author:
Bruce Crauder, Benny Evans, Alan Noell
Publisher:
Cengage Learning
Glencoe Algebra 1, Student Edition, 9780079039897…
Algebra
ISBN:
9780079039897
Author:
Carter
Publisher:
McGraw Hill
Functions and Change: A Modeling Approach to Coll…
Algebra
ISBN:
9781337111348
Author:
Bruce Crauder, Benny Evans, Alan Noell
Publisher:
Cengage Learning