e following Minitab output is for a regression of flexural strength (measured in MPa) of concrete beams on modulus of elasticity (measured in GPa). Predictor Coef Stdev t-ratio Constant 3.2921 0.6010 5.48 0.000 mod elas 0.10742 0.01277 8.41 0.000 S- 0.8657 R-sq - 73.99 R-sq (adj) - 72.84 Analysis of Variance SOURCE DF MS P 1 53.004 18.736 4ר.ור Regression 53.004 0.000 7ר .0ר Error 25 0.749 Total 26 a) Use the output to calculate a confidence Interval (In MPa) with a confidence level of 95% for the slope B, of the population regression line. (Round your answers to three decimal places.) |MPa Interpret the resulting interval. O we are 95% confident that the true average change in strength associated with a 1 GPa increase in modulus of elasticity outside this interval. O we are 95% confident that the true median change in strength associated with a 1 GPa increase in modulus of elasticity is in this interval. O We are 95% confident that the true average change in strength associated with a 1 GPa increase in modulus of elasticity is in this interval. We are 95% confident that the true median change in strength associated with a 1 GPa increase in modulus of elasticity is below this interval. b) Suppose It had previously been belleved that when modulus of elasticity increased by 1 GPa, the associated true average change in flexural strength would be at most 0.1 MPa. Does the sample data contradict this belief? Test the relevant hypotheses. State the appropriate null and alternative hypotheses. O Ho: B, = 0.1 H: Bq < 0.1 O Ho: Bq = 0.1 H: Bq = 0.1 O Họ: Bị # 0.1 H: Bq = 0.1 O Họ: Bị = 0.1 H: B, > 0.1 Compute the test statistic value and find the P-value. (Round your test statistic to two decimal places and your P-value to three decimal places.) P-value =
e following Minitab output is for a regression of flexural strength (measured in MPa) of concrete beams on modulus of elasticity (measured in GPa). Predictor Coef Stdev t-ratio Constant 3.2921 0.6010 5.48 0.000 mod elas 0.10742 0.01277 8.41 0.000 S- 0.8657 R-sq - 73.99 R-sq (adj) - 72.84 Analysis of Variance SOURCE DF MS P 1 53.004 18.736 4ר.ור Regression 53.004 0.000 7ר .0ר Error 25 0.749 Total 26 a) Use the output to calculate a confidence Interval (In MPa) with a confidence level of 95% for the slope B, of the population regression line. (Round your answers to three decimal places.) |MPa Interpret the resulting interval. O we are 95% confident that the true average change in strength associated with a 1 GPa increase in modulus of elasticity outside this interval. O we are 95% confident that the true median change in strength associated with a 1 GPa increase in modulus of elasticity is in this interval. O We are 95% confident that the true average change in strength associated with a 1 GPa increase in modulus of elasticity is in this interval. We are 95% confident that the true median change in strength associated with a 1 GPa increase in modulus of elasticity is below this interval. b) Suppose It had previously been belleved that when modulus of elasticity increased by 1 GPa, the associated true average change in flexural strength would be at most 0.1 MPa. Does the sample data contradict this belief? Test the relevant hypotheses. State the appropriate null and alternative hypotheses. O Ho: B, = 0.1 H: Bq < 0.1 O Ho: Bq = 0.1 H: Bq = 0.1 O Họ: Bị # 0.1 H: Bq = 0.1 O Họ: Bị = 0.1 H: B, > 0.1 Compute the test statistic value and find the P-value. (Round your test statistic to two decimal places and your P-value to three decimal places.) P-value =

MATLAB: An Introduction with Applications
6th Edition
ISBN:9781119256830
Author:Amos Gilat
Publisher:Amos Gilat
Chapter1: Starting With Matlab
Section: Chapter Questions
Problem 1P

Related questions
Question
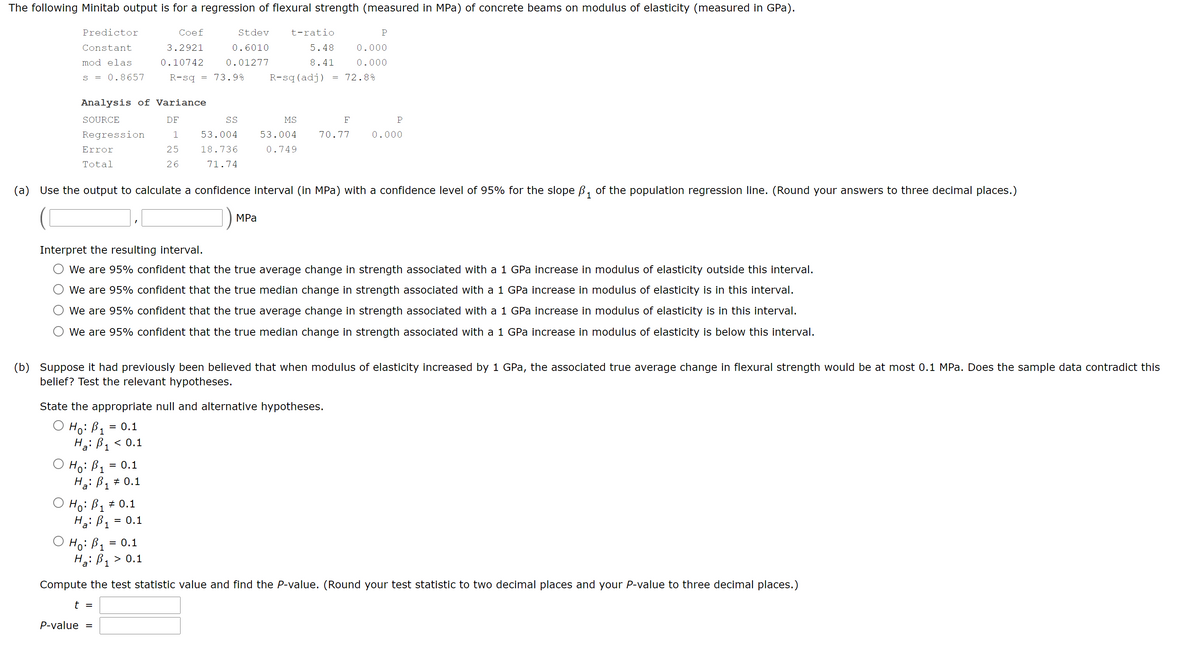
Transcribed Image Text:The following Minitab output is for a regression of flexural strength (measured in MPa) of concrete beams on modulus of elasticity (measured in GPa).
Predictor
Сoef
Stdev
t-ratio
Constant
3.2921
0.6010
5.48
0.000
mod elas
0.10742
0.01277
8.41
0.000
s = 0.8657
R-sq = 73.9%
R-sq (adj)
72.8%
Analysis of Variance
SOURCE
DF
SS
MS
F
P
Regression
53.004
53.004
70.77
0.000
Error
25
18.736
0.749
Total
26
71.74
(a) Use the output to calculate a confidence interval (in MPa) with a confidence level of 95% for the slope B, of the population regression line. (Round your answers to three decimal places.)
1
MPа
Interpret the resulting interval.
We are 95% confident that the true average change in strength associated with a 1 GPa increase in modulus of elasticity outside this interval.
We are 95% confident that the true median change in strength associated with a 1 GPa increase in modulus of elasticity is in this interval.
We are 95% confident that the true average change in strength associated with a 1 GPa increase in modulus of elasticity is in this interval.
We are 95% confident that the true median change in strength associated with a 1 GPa increase in modulus of elasticity is below this interval.
(b) Suppose it had previously been believed that when modulus of elasticity increased by 1 GPa, the associated true average change in flexural strength would be at most 0.1 MPa. Does the sample data contradict this
belief? Test the relevant hypotheses.
State the appropriate null and alternative hypotheses.
Ho: B1
H,: B, < 0.1
= 0.1
1
O Ho: B, = 0.1
H2: B1 # 0.1
O Hoi Bq # 0.1
H: B1
H :
a
= 0.1
a
O Ho: B1 = 0.1
H,: B, > 0.1
1
Compute the test statistic value and find the P-value. (Round your test statistic to two decimal places and your P-value to three decimal places.)
t =
P-value =
Expert Solution
This question has been solved!
Explore an expertly crafted, step-by-step solution for a thorough understanding of key concepts.

This is a popular solution!

Trending now
This is a popular solution!

Step by step
Solved in 2 steps with 2 images

Recommended textbooks for you
MATLAB: An Introduction with Applications
Statistics
ISBN:
9781119256830
Author:
Amos Gilat
Publisher:
John Wiley & Sons Inc

Probability and Statistics for Engineering and th…
Statistics
ISBN:
9781305251809
Author:
Jay L. Devore
Publisher:
Cengage Learning

Statistics for The Behavioral Sciences (MindTap C…
Statistics
ISBN:
9781305504912
Author:
Frederick J Gravetter, Larry B. Wallnau
Publisher:
Cengage Learning
MATLAB: An Introduction with Applications
Statistics
ISBN:
9781119256830
Author:
Amos Gilat
Publisher:
John Wiley & Sons Inc
Probability and Statistics for Engineering and th…
Statistics
ISBN:
9781305251809
Author:
Jay L. Devore
Publisher:
Cengage Learning
Statistics for The Behavioral Sciences (MindTap C…
Statistics
ISBN:
9781305504912
Author:
Frederick J Gravetter, Larry B. Wallnau
Publisher:
Cengage Learning

Elementary Statistics: Picturing the World (7th E…
Statistics
ISBN:
9780134683416
Author:
Ron Larson, Betsy Farber
Publisher:
PEARSON

The Basic Practice of Statistics
Statistics
ISBN:
9781319042578
Author:
David S. Moore, William I. Notz, Michael A. Fligner
Publisher:
W. H. Freeman

Introduction to the Practice of Statistics
Statistics
ISBN:
9781319013387
Author:
David S. Moore, George P. McCabe, Bruce A. Craig
Publisher:
W. H. Freeman