E, Quantity fer to the image above. A change from Point A to Point B represents a increase in supply. decrease in supply. increase in quantity supplied. decrease in quantity supplied.
E, Quantity fer to the image above. A change from Point A to Point B represents a increase in supply. decrease in supply. increase in quantity supplied. decrease in quantity supplied.

Micro Economics For Today
10th Edition
ISBN:9781337613064
Author:Tucker, Irvin B.
Publisher:Tucker, Irvin B.
Chapter5: Price Elasticity Of Demand And Supply
Section: Chapter Questions
Problem 16SQ

Related questions
Question
Transcribed Image Text:E
Quantity
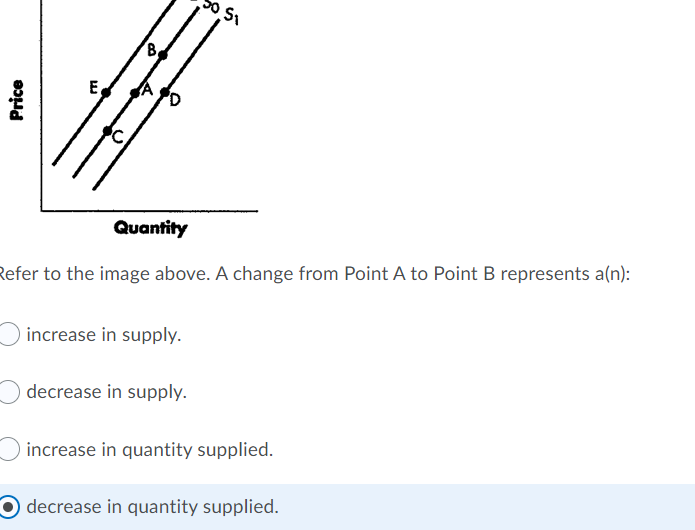
Refer to the image above. A change from Point A to Point B represents a(n):
increase in supply.
decrease in supply.
increase in quantity supplied.
decrease in quantity supplied.
Price
Expert Solution
This question has been solved!
Explore an expertly crafted, step-by-step solution for a thorough understanding of key concepts.

This is a popular solution!

Trending now
This is a popular solution!

Step by step
Solved in 2 steps

Knowledge Booster


Learn more about
Need a deep-dive on the concept behind this application? Look no further. Learn more about this topic, economics and related others by exploring similar questions and additional content below.Recommended textbooks for you


Managerial Economics: A Problem Solving Approach
Economics
ISBN:
9781337106665
Author:
Luke M. Froeb, Brian T. McCann, Michael R. Ward, Mike Shor
Publisher:
Cengage Learning


Microeconomics: Private and Public Choice (MindTa…
Economics
ISBN:
9781305506893
Author:
James D. Gwartney, Richard L. Stroup, Russell S. Sobel, David A. Macpherson
Publisher:
Cengage Learning