E Questiur State whether each of the following changes would make a confidence interval wider or narrower. (Assume that nothing else changes.) a. Changing from a 95% confidence level to a 90% confidence level. b. Changing from a sample size of 250 to a sample size of 15. c. Changing from a standard deviation of 25 pounds to a standard deviation of 20 pounds. E Click the icon to view the t-table.
E Questiur State whether each of the following changes would make a confidence interval wider or narrower. (Assume that nothing else changes.) a. Changing from a 95% confidence level to a 90% confidence level. b. Changing from a sample size of 250 to a sample size of 15. c. Changing from a standard deviation of 25 pounds to a standard deviation of 20 pounds. E Click the icon to view the t-table.

MATLAB: An Introduction with Applications
6th Edition
ISBN:9781119256830
Author:Amos Gilat
Publisher:Amos Gilat
Chapter1: Starting With Matlab
Section: Chapter Questions
Problem 1P

Related questions

Topic Video
Question
Statistics question
Transcribed Image Text:Question Heip
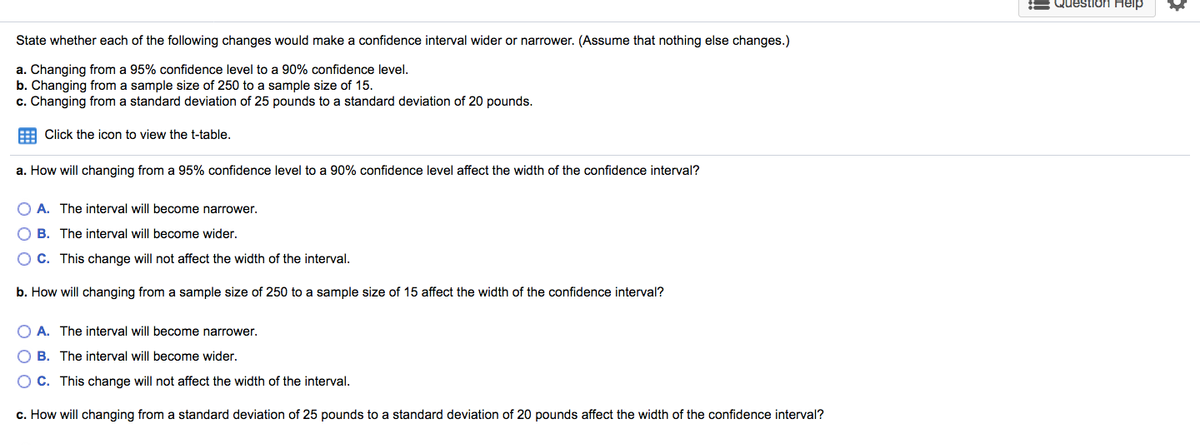
State whether each of the following changes would make a confidence interval wider or narrower. (Assume that nothing else changes.)
a. Changing from a 95% confidence level to a 90% confidence level.
b. Changing from a sample size of 250 to a sample size of 15.
c. Changing from a standard deviation of 25 pounds to a standard deviation of 20 pounds.
E Click the icon to view the t-table.
a. How will changing from a 95% confidence level to a 90% confidence level affect the width of the confidence interval?
O A. The interval will become narrower.
O B. The interval will become wider.
O C. This change will not affect the width of the interval.
b. How will changing from a sample size of 250 to a sample size of 15 affect the width of the confidence interval?
O A. The interval will become narrower.
O B. The interval will become wider.
O C. This change will not affect the width of the interval.
c. How will changing from a standard deviation of 25 pounds to a standard deviation of 20 pounds affect the width of the confidence interval?
Transcribed Image Text:Right Tail
Probability
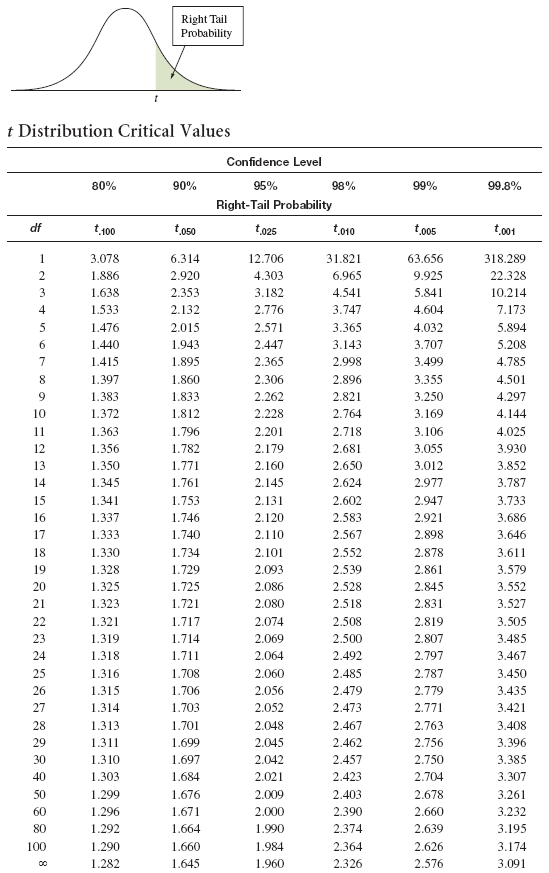
t Distribution Critical Values
Confidence Level
80%
90%
95%
98%
99%
99.8%
Right-Tail Probability
df
t,100
t.o50
t025
to10
to05
t,001
1
3.078
6.314
12.706
31.821
63.656
318.289
2
1.886
2.920
4.303
6.965
9.925
22.328
3
1.638
2.353
3.182
4.541
5.841
10.214
4
1.533
2.132
2.776
3.747
4.604
7.173
1.476
2.015
2.571
3.365
4.032
5.894
6.
1.440
1.943
2.447
3.143
3.707
5.208
7
1.415
1.895
2.365
2.998
3.499
4.785
8.
1.397
1.860
2.306
2.896
3.355
4.501
1.383
1.833
2.262
2.821
3.250
4.297
10
1.372
1.812
2.228
2.764
3.169
4.144
11
1.363
1.796
2.201
2.718
3.106
4.025
12
1.356
1.782
2.179
2.681
3.055
3.930
13
1.350
1.771
2.160
2.650
3.012
3.852
14
1.345
1.761
2.145
2.624
2.977
3.787
15
1.341
1.753
2.131
2.602
2.947
3.733
16
1.337
1.746
2.120
2.583
2.921
3.686
17
1.333
1.740
2.110
2.567
2.898
3.646
18
1.330
1.734
2.101
2.552
2.878
3.611
19
1.328
1.729
2.093
2.539
2.861
3.579
20
1.325
1.725
2.086
2.528
2.845
3.552
21
1.323
1.721
2.080
2.518
2.831
3.527
22
1.321
1.717
2.074
2.508
2.819
3.505
23
1.319
1.714
2.069
2.500
2.807
3.485
24
1.318
1.711
2.064
2.492
2.797
3.467
25
1.316
1.708
2.060
2.485
2.787
3.450
26
1.315
1.706
2.056
2.479
2.779
3.435
27
1.314
1.703
2.052
2.473
2.771
3.421
28
1.313
1.701
2.048
2.467
2.763
3.408
29
1.311
1.699
2.045
2.462
2.756
3.396
30
1.310
1.697
2.042
2.457
2.750
3.385
40
1.303
1.684
2.021
2.423
2.704
3.307
50
1.299
1.676
2.009
2.403
2.678
3.261
60
1.296
1.671
2.000
2.390
2.660
3.232
80
1.292
1.664
1.990
2.374
2.639
3.195
100
1.290
1.660
1.984
2.364
2.626
3.174
1.282
1.645
1.960
2.326
2.576
3.091
00
Expert Solution
This question has been solved!
Explore an expertly crafted, step-by-step solution for a thorough understanding of key concepts.

This is a popular solution!

Trending now
This is a popular solution!

Step by step
Solved in 2 steps with 2 images

Knowledge Booster


Learn more about
Need a deep-dive on the concept behind this application? Look no further. Learn more about this topic, statistics and related others by exploring similar questions and additional content below.Recommended textbooks for you
MATLAB: An Introduction with Applications
Statistics
ISBN:
9781119256830
Author:
Amos Gilat
Publisher:
John Wiley & Sons Inc

Probability and Statistics for Engineering and th…
Statistics
ISBN:
9781305251809
Author:
Jay L. Devore
Publisher:
Cengage Learning

Statistics for The Behavioral Sciences (MindTap C…
Statistics
ISBN:
9781305504912
Author:
Frederick J Gravetter, Larry B. Wallnau
Publisher:
Cengage Learning
MATLAB: An Introduction with Applications
Statistics
ISBN:
9781119256830
Author:
Amos Gilat
Publisher:
John Wiley & Sons Inc
Probability and Statistics for Engineering and th…
Statistics
ISBN:
9781305251809
Author:
Jay L. Devore
Publisher:
Cengage Learning
Statistics for The Behavioral Sciences (MindTap C…
Statistics
ISBN:
9781305504912
Author:
Frederick J Gravetter, Larry B. Wallnau
Publisher:
Cengage Learning

Elementary Statistics: Picturing the World (7th E…
Statistics
ISBN:
9780134683416
Author:
Ron Larson, Betsy Farber
Publisher:
PEARSON

The Basic Practice of Statistics
Statistics
ISBN:
9781319042578
Author:
David S. Moore, William I. Notz, Michael A. Fligner
Publisher:
W. H. Freeman

Introduction to the Practice of Statistics
Statistics
ISBN:
9781319013387
Author:
David S. Moore, George P. McCabe, Bruce A. Craig
Publisher:
W. H. Freeman