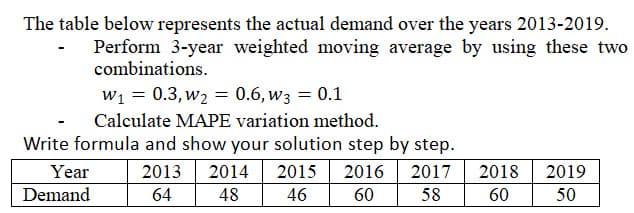
e table below represents the actual demand over the years 2013-2019. Perform 3-year weighted moving average by using these two combinations. W1 = 0.3, w2 = 0.6, w3 = 0.1 - Calculate MAPE variation method. ite formula and show your solution step by step.


Q: a. Suppose that the weekly demand forecast of 95 bags is incorrect and actual demand averages only…
A: Given, Actual demand = 95 bags/ week Annual demand D = 95*50 = 4750 bags Order cost S = $50 Holding…
Q: MGMT Bakehouse Inc supplies bread, cakes and other specialty products, to a large percentage of the…
A: given, There have been complaints that some product lines and/or customers are experiencing high…
Q: If you have a third option for the data in Problem( Your options for shipping $100,000 of machine…
A: a)given,in order to ship $100,000 of machine it will take 30 days at a cost of $3800estimated…
Q: I need a detailed assistance to solve the following problem in: Operations Analysis. 1) A trucking…
A: Step1: Calculating the value of monthly carrying cost per truck. We have,Monthly carrying cost per…
Q: G E D в A Application of weights 1month oder quantity 20 weights the month 0.3 1 2month 0.4 15 2…
A: This is the information given:
Q: 3. Consider the supply chain illustrated below: 1200 600 1150 Manufacturer Wholesaler Retailer 500…
A:
Q: Requlred: 1. Calculate the Blending Department's equivalent units of production for materials and…
A: As per the guidelines of Bartleby, only 2 questions have been answered. For getting answers to the…
Q: Over the past 5 weeks, demand for wine at Winston's Winery has averaged 1,940 bottles, and the…
A: The bullwhip effect refers to the fluctuations caused in demand and supply. These fluctuations can…
Q: c) (i) A company manufactures a component which it sells for £100. The variable cost associated with…
A: (c) (i) Let x be the quantity Selling price = 100 euros Equation = 100*x Fixed cost = 384,000 euros…
Q: Occupancy Percentage ADR (Average Daily Rate) RevPAR (Revenue per Available Room)
A: Below is the solution:-
Q: 43 & 44
A: Determine the seasonality variation in public bank:Public bank would experience the seasonality…
Q: Demand for devil’s food whipped-cream layer cake at a local pastry shop can be approximatedusing a…
A: Mean (M) = 6 per day Cost (C) = $9 per cake Selling price (P) = $12 Salvage value (S) = $9
Q: The Rainwater Brewery produces Rainwater Light Beer, which it stores in barrels in its warehouse and…
A: Economic order quantity (EOQ) EOQ = 2*Sc*DH Sc = Setup cost D = Demand H = Holding cost Annual…
Q: Consider a two-stage plant-retailer supply chain. Lead time for orders is two weeks. Safety stock is…
A: Production planning refers to the module that utilizes the allocate the resource with the materials,…
Q: RevPAR This month Last 3 months Last 12 months
A: Here, we need to learn about various important formula, First, we would calculate the Index value,…
Q: Cindy’s favorite product in the store is the carrot cookie. Healthy Goods started selling carrot…
A: Maximum demand = 204 Minimum demand = 49 Planned stock = 85 Probability of not fulfilling all the…
Q: Suppose the demand for garlic bread falls. Illustrate the effect this has on the market for garlic…
A: An economy is where transaction occurs for profits. Many entity are present in an economy affecting…
Q: Kooyman hardware sells 35 different types of drills. They had demand for 29 of the drills and…
A: Fill rate is the proportion between total demand delivered and total demand of requested. Here, we…
Q: Consider a two-stage plant-retailer supply chain. Lead time for orders is two weeks. Safety stock is…
A: The planning for production as well as manufacturing modules in a firm or industry is known as…
Q: A company has the following actual and forecasted demand history for eight periods: Period Actual 26…
A: Solution Tracking signal is calculated as the ratio of cumulative error divided by the mean absolute…
Q: apolis, makes weekily shipments to area. Each customers order weighs, on average, 2,000 pounds. A…
A: Given, Number of customers = 25 Weight of each order = 2,000 pounds Cost of a direct truck shipment…
Q: Identify several industries that have highly variable demandpatterns. Explore how they adjust…
A: For certain industries, the demand-pattern is extremely uncertain. It becomes highly cumbersome to…
Q: In exponential smoothing method, which one of the following statements is true? O a. Alpha is…
A: Exponential smoothing is a predictable method of time series that can be extended to support data…
Q: PLEASE PROVIDE DETAILED EXPLANATIONS
A: Production is the process of manufacturing the finished products using the raw materials and…
Q: Greenfield's Tannery supplies leather to the South Fork Boot Company on a monthly basis for…
A: From the given data: Here is the excel Formulation for Three month and Five month moving average
Q: Samsung implements a Continuous Inventory System for an electronic component. The inventory manager…
A:
Q: snip
A: Forecasting is a technique that predicts the occurrence of some event in the future. In operations…
Q: Demand for walnut fudge ice cream at the Sweet Cream Dairy can be approximated by a normal…
A: a1. Given Data, Lead time = 2 days Daily Order = 24/7 = 3.428 Gallon Before we apply the reorder…
Q: Consider the supply chain illustrated here:Last year, the retailer's weekly variance of demand was…
A: Note - Hi! Thank you for the question, As per the honour code, we are allowed to answer three…
Q: Sapphire Aerospace operates 52 weeks per year, and its cost of goods sold last year was $6,500,000.…
A: 52 weeks per year COGS = $6,500,000
Q: Calculate a forecast of the above demand using a three-month and a five-month moving average in a…
A: A moving average refers to a calculation for analyzing the data through the creation of average…
Q: Togo makes riding lawn mowers and tractors. The company's expected quarterly demand is given below…
A: Given- Production cost per unit = $210Inventory carrying cost = $30Hiring cost per worker =…
Q: Greenfield’s Tannery supplies leather to the South Fork Boot Company on a monthly basis for…
A: Find the Given details below: Given Details: Month Demand (in square yards) January 1300…
Q: Director of legal services of ABC Company must decide whether to hire another full-time lawyer or to…
A: Given data is
Q: Knights Ltd Wayne tells you he is planning the 30 June 2021 Audit of Knights Ltd, a company that…
A: Below will be the business risk effects for Knights Ltd: There will be an effect of financial risk…
Q: The following lots of a particular commodity were available for sale during the year Beginning…
A: Calculation of cost of goods available for sale Date Units Unit cost Total cost Beginning…
Q: 1) Assume that you are a manager of one of the hotels in the UAE. As you know, UAE has an excellent…
A: 1) Demand for room in Hotels increases in UAE in a specific period of time and then decreases once…
Q: A firm’s cost of goods sold last year was $3,410,000, and the firm operates 52 weeks per year. It…
A: COGS = 3,410,000 52 weeks per year
Q: Demand of Hairdryer from January to July Month Demand January 2800 February 2870 March…
A: a) 3 months simple moving average Given data: Month Demand 3 months simple moving average…
Q: Consider that a company produces a certain component in batches of 795 units (Q) for its computer…
A: Batch Size (Q) = 795 units Production rate = P = 13,655 units / year The rest of the data is…
Q: Elite Distributor magazine is currently working on determining the number of publications they…
A: From the question, I would determine how many magazines are to be printed before the trade show,…
Q: Last year, the retailer's weekly variance of demand was 100 units. The variance of orders was 250,…
A: Bullwhip effect: Bullwhip effect is known as a distribution problem where forecasts used to cause…
Q: Consider the supply chain illustrated below: Last year, the retailer’s weekly variance of demand…
A: "Since you have posted a question with multiple sub-parts, we will solve the first three sub-parts…
Q: Manufacturer Distributor Wholesaler Retailer Last year the retailer's weekly variance of demand was…
A: Given, Demand - 210 units Variance order- 470,610,770,1300 units.
Q: As manager of the St. Cloud Theatre Company, you have decided that concession sales will support…
A: We know that, Contribution margin pu = SP per unit – VC per unit – Waste allowance per unit Assuming…
Q: A firm’s cost of goods sold last year was $3,410,000, and the firm operates 52 weeks per year. It…
A:

please try to provide solution in 30 min

Step by step
Solved in 2 steps with 2 images


- In Problem 12 of the previous section, suppose that the demand for cars is normally distributed with mean 100 and standard deviation 15. Use @RISK to determine the best order quantityin this case, the one with the largest mean profit. Using the statistics and/or graphs from @RISK, discuss whether this order quantity would be considered best by the car dealer. (The point is that a decision maker can use more than just mean profit in making a decision.)Lemingtons is trying to determine how many Jean Hudson dresses to order for the spring season. Demand for the dresses is assumed to follow a normal distribution with mean 400 and standard deviation 100. The contract between Jean Hudson and Lemingtons works as follows. At the beginning of the season, Lemingtons reserves x units of capacity. Lemingtons must take delivery for at least 0.8x dresses and can, if desired, take delivery on up to x dresses. Each dress sells for 160 and Hudson charges 50 per dress. If Lemingtons does not take delivery on all x dresses, it owes Hudson a 5 penalty for each unit of reserved capacity that is unused. For example, if Lemingtons orders 450 dresses and demand is for 400 dresses, Lemingtons will receive 400 dresses and owe Jean 400(50) + 50(5). How many units of capacity should Lemingtons reserve to maximize its expected profit?North Dakota Electric Company estimates its demand trend line (in millions of kilowatt hours) to be: D = 80.0 + 0.43Q, where Q refers to the sequential quarter number and Q = 1 for winter of Year 1. In addition, the multiplicative seasonal factors are as follows: Quarter Factor (Index) Winter 0.80 Spring 1.25 Summer 1.45 Fall 0.50 In year 26 (quarters 101-104), the energy use for each of the quarters beginning with winter is (round your response to one decimal place): Quarter Energy Use Winter 98.798.7 Spring nothing
- North Dakota Electric Company estimates its demand trend line (in millions of kilowatt hours) to be: D = 80.0 + 0.43Q, where Q refers to the sequential quarter number and Q = 1 for winter of Year 1. In addition, the multiplicative seasonal factors are as follows: Quarter Factor (Index) Winter 0.80 Spring 1.25 Summer 1.45 Fall 0.50 In year 26 (quarters 101-104), the energy use for each of the quarters beginning with winter is (round your response to one decimal place):The accompanying table shows a bookstore's estimated demand for a new calendar. The bookstore needs to decide whether to order100, 200, or 300 calendars for the start of the year. Each calendar costs the store$5 to purchase and can be sold for $13. The store can sell any unsold calendars back to its supplier for $3 each. Determine the number of calendars the bookstore should order to maximize its expected monetary value. Demand Probability 100 0.35 200 0.25 300 0.40 The bookstore should order---------calendars in order to have the maximum expected monetary value of $----- (Type a whole number.)The distribution of daily demand for rental trucks at a vehicle rental company is shown in the following table: Relative Frequency Demand 0.07 0 0.14 1 0.15 2 0.14 3 0.12 4 0.08 5 0.3 6 Trucks are rented by the day only and the company makes $14 per rented truck per day. The rental company keeps four trucks at this location. Assuming that the stocking decision is optimal, what is the implied range of excess cost per truck per day? a. 0 and 186 b. 8.58064 and 14 c. 14 and 24.8889 d. 6 and 8.58064 e. 34.2759 and 79.3333
- The distribution of daily demand for party cakes at a bakery is shown in the following table: Relative Frequency Demand 0.08 18 0.02 21 0.02 34 0.04 43 0.07 56 0.38 67 0.12 87 0.27 114 Determine the optimal number of cakes to make each day if labour and material are estimated to cost $35.455 per unit. Cakes are sold for $50.65 per unit, and leftover cakes at the end of the day are sold next day at half price. a. 114 b. 67 c. 87 d. 43 e. 56Aboloway Company stocks a part that has a daily demand represented by the empirical distribution (shown in the table below). When restocking this part, the average lead time from the supplier is 3 days with a standard deviation of 0.5 days. The plant manager wants to determine how much safety stock to maintain for this part to ensure that stock-outs will not be incurred in more than 5.5% of the order cycles. Daily demand (d) in units Frequency 5 10 10 35 15 65 20 32 25 8 Total Observations = 150 3a. Find the mean and standard deviation for demand. 3b. Based on the information in problems 3 and 3a, what is the mean and standard deviation of demand during the lead time? 3c. Based on the information in problems 3, 3a, and 3b, how much safety stock should the plant manager maintain to ensure that stock-out will not be incurred in more than 5.5% of the order cycles?Target is considering opening mini-Target stores in airports across the United States. Target knows that 25% of the items in its store account for 70% of the store's sales and expects that this Pareto relationship will hold for the mini-Target stores. The mini-Targets will each carry 50 items, but it's unknown at this point which 50 items will be stocked. The annual sales of a mini-Target is forecasted to be $500,000. Assume A items are top 20% of items sold, B items are the next 30% and C items are the bottom 50% of items sold. Turnover is expected to be for A items = 50, B items = 40 and C items = 10. 1. The top 20% of items in the min-Target store will account for what percent of sales? - 42.9% - 56.2% - 68.7% - 63.6% 2. What is the annual item sales expected to be for the 25th best selling product in the mini-Target store? - $113 - $4,510 - $437,500 - $76,350
- Target is considering opening mini-Target stores in airports across the United States. Target knows that 25% of the items in its store account for 70% of the store's sales and expects that this Pareto relationship will hold for the mini-Target stores. The mini-Targets will each carry 50 items, but it's unknown at this point which 50 items will be stocked. The annual sales of a mini-Target is forecasted to be $500,000. Assume A items are top 20% of items sold, B items are the next 30% and C items are the bottom 50% of items sold. Turnover is expected to be for A items = 50, B items = 40 and C items = 10 1. The top 20% of items in the min-Target store will account for what percent of sales? A. 63.6% B. 68.7% C. 56.2% D. 42.9% 2. What is the annual item sales expected to be for the worst selling product in the mini-Target store? A. $145 B. $1,453 C. $13,905 D. $32,781[item no. 9] In marginal analysis with discrete distributions for single-period inventory models, the value of ML/(ML+MP) is 0.8. The probability distribution of sales is given by the following by the table below. Find the optimal number of units to order. Daily demand 80 90 100 110 120 Probability that demand will be at this level 0.10 0.20 0.30 0.30 0.10 a. 90 units b. 110 units c. 100 units d. 80 unitsThe "Footcandy" shoes store supplies men's black formal shoes. Every 3 months the "Footcandy" shoes store can sell approximately 500 pairs of shoes at a constant price. The store is currently ordering 500 everytime they order. It costs $ 30 to place the order. 20% is the annual rate for the storage fee. With an order of 500 pairs of shoes, the store got the lowest price at $ 28 per pair. The order quantity discounts offered by the manufacturer are as follows Quantity Price 1 0-99 $36 2 100-199 $32 3 200-299 $30 4 300 $28 a. What is the minimum cost order amount for the shoes? b. What is the annual savings from Footcandy Store?