e table. Include a minus sign (-) for any negative values entered below. (2) (3) Total Product Marginal Product Average Product (pots per day) (4) per (pots per day) (pots per day) 80 220 405 440 425 mployment range is marginal product rising? falling and positive? negative? oduct is rising when the first, second, and third workers are hired and total product in this range is risin pduct is falling and positive when the fourth worker is hired and total product in this range is rising at oduct is negative when the fifth worker is hired and total product in this range is falling
e table. Include a minus sign (-) for any negative values entered below. (2) (3) Total Product Marginal Product Average Product (pots per day) (4) per (pots per day) (pots per day) 80 220 405 440 425 mployment range is marginal product rising? falling and positive? negative? oduct is rising when the first, second, and third workers are hired and total product in this range is risin pduct is falling and positive when the fourth worker is hired and total product in this range is rising at oduct is negative when the fifth worker is hired and total product in this range is falling

Chapter11: Labor Markets
Section: Chapter Questions
Problem 1SQ

Related questions
Question
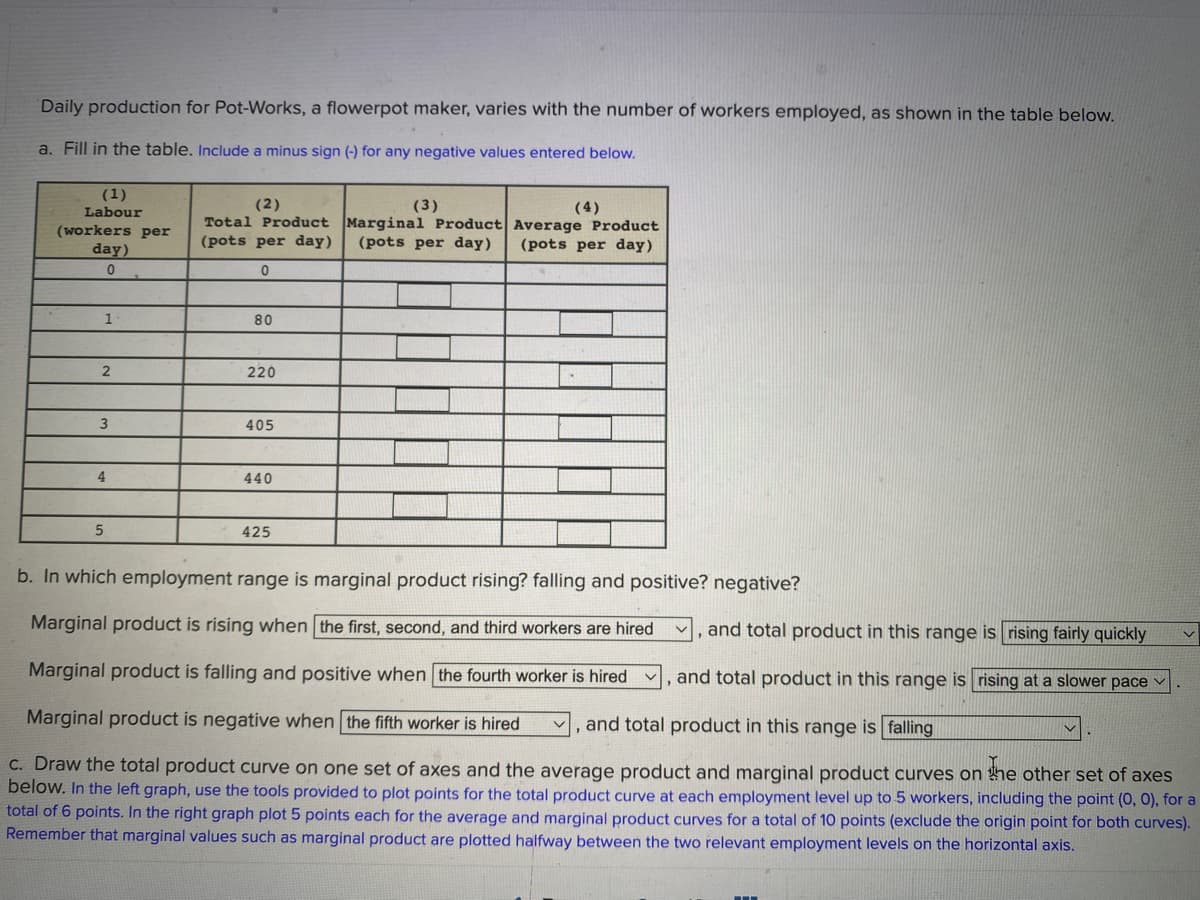
Transcribed Image Text:Daily production for Pot-Works, a flowerpot maker, varies with the number of workers employed, as shown in the table below.
a. Fill in the table. Include a minus sign (-) for any negative values entered below.
(1)
Labour
(workers per
day)
(2)
(3)
(4)
Total Product Marginal Product| Average Product
(pots per day)
(pots per day)
(pots per day)
1
80
2
220
405
4
440
425
b. In which employment range is marginal product rising? falling and positive? negative?
Marginal product is rising when the first, second, and third workers are hired
and total product in this range is rising fairly quickly
Marginal product is falling and positive when the fourth worker is hired v, and total product in this range is rising at a slower pace v
Marginal product is negative when the fifth worker is hired
, and total product in this range is falling
C. Draw the total product curve on one set of axes and the average product and marginal product curves on he other set of axes
below. In the left graph, use the tools provided to plot points for the total product curve at each employment level up to 5 workers, including the point (0, 0), for a
total of 6 points. In the right graph plot 5 points each for the average and marginal product curves for a total of 10 points (exclude the origin point for both curves).
Remember that marginal values such as marginal product are plotted halfway between the two relevant employment levels on the horizontal axis.
Expert Solution
This question has been solved!
Explore an expertly crafted, step-by-step solution for a thorough understanding of key concepts.

Step by step
Solved in 2 steps with 2 images

Knowledge Booster


Learn more about
Need a deep-dive on the concept behind this application? Look no further. Learn more about this topic, economics and related others by exploring similar questions and additional content below.Recommended textbooks for you


Economics (MindTap Course List)
Economics
ISBN:
9781337617383
Author:
Roger A. Arnold
Publisher:
Cengage Learning