e they are by flavor:
Q: Find the remaining class frequencies, given the following data: N=23,713, JA) =1618, (B) = 2015,…
A: From the given data it is observed that there are 3 attributes A, B and C N = total frequency n…
Q: Evaluate ds, C: z = t, y =t, 0sts8
A: Given: x=t2 and y=t⇒x'(t)=2t and y'(t)=1 Now: ds=x'(t)2+y'(t)2…
Q: Use the table below to answer the following. # of pizzas # of people How many pizzas are needed for…
A: if 7 People require 3 pizzas 217 people how much pizzas(?) =(217*3)/7 =93 pizzas
Q: Q2: Evaluate feascos2 (y s) ds. إضافة ملف
A:
Q: Given s(t) = t3 − 5t + 8, evaluate. s(−1)
A:
Q: 1. If you were to shade of the figure below, how many boxes would you shade?
A: Given:68
Q: Determine which color is represented by each of the following. Assume the colors are being mixed…
A:
Q: A.How many elements are in (C U R)? How many elements are in ( C U R) U A ? how many elements are…
A: A Venn diagram is a representation of sets and their intersection. The union of any two sets is a…
Q: 22. 0 E N 24. {1, 5, 9}~ {¥, II, E}
A: 22. 0∉N23. 1,5,9 ~Ψ,π,Σ
Q: Evaluate: E 4 · 4* 4. 4*- 1 O 248555 O 292247 O 349524
A:
Q: In (IR, 7sorg), if A = T. sorg :n EN and B = (2, 3) then AUB=
A: A closure is the smallest closed set containing A.
Q: 4)Given determine
A:
Q: Find the missing leng C = Evaluate the se before enter answe 8
A: given base = 8 perpendicular= 6 hypotenuse = c
Q: s is and the leng
A:
Q: If o(E) = 5:7, find o(E'). o(E') =
A: The formula for odds of event E is, oE=PE1-PE The odds of E can be written as, m:n or mn. The…
Q: You are given:
A: Formulas: pxt+qx=1t px=t+upx*px+tut qt|ux=qt+ux-qtx Consider, the given equations,…
Q: Enplain nwhy s?Pdm= for PEIN. a
A: Consider the given integration ∫abxPdx=bP+1P+1-aP+1P+1 Where P∈ℕ
Q: Given N= 1482, (A) = 368, (B) = 343 and (AB) = %3D 35, find Yule's coefficient of association?
A:
Q: given 9 12 25 _ 41 48 nat is the missing value? e missing value is
A: Given ordered data is 9,12,25,x,41,48 The median is 31.5 What is the missing value ? x=?
Q: I need help with A, C, and D
A:
Q: {b_n}={3^n/n!}
A:
Q: In ALOV, LO = LV. If má0 = 75°, what is the maL? A. 30° В. 45° С. 60° D. 150°
A: In order to evaluate the angle L, angle sum property of a triangle has to be used. Angle sum…
Q: Byusing Simpson'stYule sotvethe febbot ing 千 fsinxdx;N=6 and (20) then find the Valafive etror
A:
Q: Suppose that S = { x | x ∈ N , and 9 ≤ x ≤ 270 } What is | S | ?
A: We are given that S = { x | x ∈ N , and 9 ≤ x ≤ 270}. Now, we need to find the cardinality of the…
Q: ) Given R:715, M: {,5.103 then R/M is
A:
Q: Find populatan Since relatine graw th vate18447 frer 6 dags nSize
A:
Q: On Z+, a * b = aº ||
A:
Q: . evaluate perm(5,3)= b. evaluate perm(22,6)= c. evaluate comb(5,3)=
A: a. evaluate perm(5,3)=? b. evaluate perm(22,6)=? c. evaluate comb(5,3)=?
Q: The degrees of freedom for SST are O 3 O 27 O 35
A: If we take as an integer number so for is given by dof= N-1 N is sample size
Q: Use the union rule to answer. If n(A) = 8, n(B) = 10 and n(AB) = 6, what is n(AUB)?
A: given data,here we have to use union rule of probability n(A)= 8n(B)=10n(A∩B)=6n(A∪B)=?
Q: Let a, b, c € Z. If c divides a+b, then e divides both a and b.
A:
Q: AWVU = AGHI ZW= ?
A: Topic = Triangles
Q: *Rind the pneral slubon ar general sdubon Bar
A:
Q: If 125% of x is 80 and x is n% of 400, what is the value of n? dd inages tere
A:
Q: The chemical epinephrine (more commonly known as adrenaline) has the chemical formula CH(OH),C3H,NH.…
A:
Q: Given the following observations, determine an 3 ^ 1 5 66 7 8 8
A: Given, 3, 4, 4, 5, 6, 6, 7, 8, 8, 9
Q: tiw ul 2ding) maX well defned
A: Given d(x,y)=max| xk-yk|
Q: If c+ id = (1- iV3), find e and d.
A: Given: c+id=1-i3100 We know that rcosθ+isinθ=reiθ…
Q: e tankx - Scek'sx ethix-= csch?
A:
Q: :) OVER LAPPING, DIS JOINT OR SUBSET OF THE OTHER.
A: As per guidelines if multiple questions are posted we are allowed to solve only 1st question...
Q: 4 Which of the following represents inear tunctfen C. B. D. 十+ ++
A: To write that which function is a linear function
Q: (e) a does not divide bc or a divides b or a divides c.
A: The given statement is a divides bc, then a divides b or a divide c. That is for any integers a,b…
Q: Which Venn diagram illustrates the given conditions? a. ACB and B C? (select) b. a. B. d. A A, C.
A:
Q: 1) X, Y,2 O, elsewheve
A: Given, f(x, y, z)=kxy2z0<x or y<1, 0<z<20elsewhere
Q: GIVEN S(x, y) = {0. , 0<r<2, 2<y<4, elsewhere, 10,
A:
Q: 1) Explain why the following combinations are the same: C y ).
A: The formula for finding combinations is Ckn=n!k!n-k!
Q: The lcm of of 24, 60 , 72 and 90 is _?
A: I am attaching image so that you understand each and every step.
Q: At Bank A, customers
A:
Step by step
Solved in 2 steps with 2 images
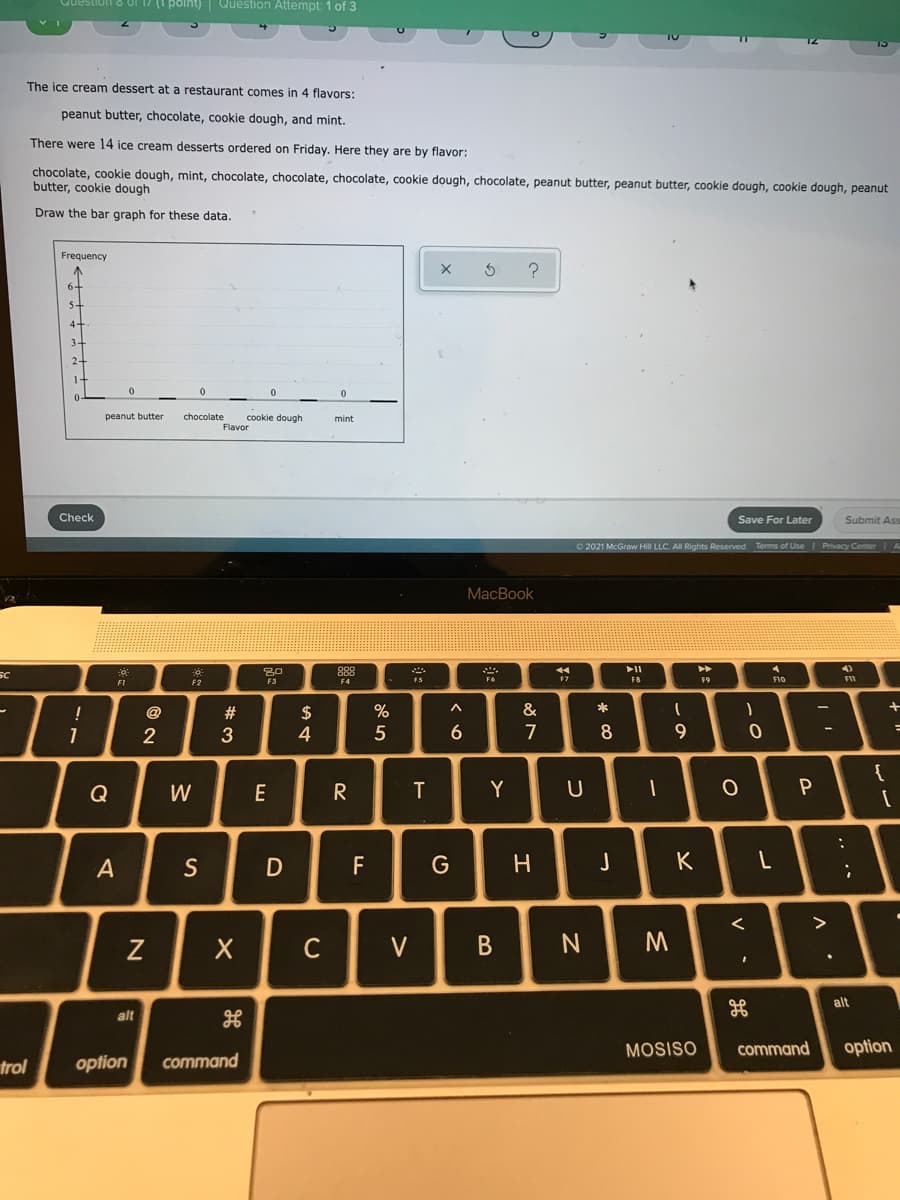
- The ice cream dessert at a restaurant comes in 4 flavors:strawberry, cookie dough, peanut butter, and lemon.There were 15 ice cream desserts ordered on Friday. Here they are by flavor: lemon, lemon, peanut butter, lemon, peanut butter, strawberry, lemon, strawberry, lemon, lemon, lemon, cookie dough, cookie dough, cookie dough, lemon Draw the bar graph for these data.A Hong Kong snack-food vendor offers 3 types of boxed ”lunches to go,” priced at $3, $5, and $10, respectively. The vendor would like to establish whether there is a relationship between the price of the boxed lunch and the number of sales achieved per hour. Consequently, over a 15-day period the vendor records the number of sales made for each of the 3 types of boxed lunches. The following data show the boxed-lunch price (x) and the number sold (y) during each of the 15 lunch hours.(3, 7) (5, 5) (10, 2) (3, 9) (5, 6) (10, 5) (3, 6) (5, 6)(10, 1) (3, 10) (5, 7) (10, 4) (3, 5) (5, 6) (10, 4)Prepare a scatter plot of the points and comment on the relationship between the price of the boxed lunches and the numbers sold each lunchtime.Following some school examinations, Ajok is studying the results of the 16 students in her class. The mark for paper 1, , and the mark for paper 2, , for each student are summarised in the following statistics. X Mean= 35.75 , Y Mean=25.75 , St Dev of X=8.05 ,St Dev of Y=12.3 , R=0.75 Ajok decides to examine these data in more detail and plots the marks for each of the 16 students on the scatter diagram. Graph Attached Using the summary statistics above, calculate the equation of the line of regression of y on x for these 16 students, giving your answer in the form yhat = a+bx Ajok decides to omit the data point (38,0) and examine the other 15 students’ marks. The correlation coefficient is now R = 0.95. Explain why you think Ajok decides to omit the data point (38.0). Using the following summary statistics calculate the equation of the line of regression of y on x for these 15 students X Mean= 35.6 , Y Mean=27.47 , St Dev of X=8.31 ,St Dev of Y=10.56, R=0.95 Give your answer…
- 1, on the survey, the question "what is your favorite season: winter, spring, summer, fall?" appears. a) what type of data (continuous, discrete, categorical) is being collected?. explain. b) what type of graph would be best to represent this information? explain.A doctor wanted to determine whether there is a relation between a male's age and his HDL (so-called good) cholesterol. The doctor randomly selected 17 of his patients and determined their HDL cholesterol. The data obtained by the doctor is the in the data table below. Complete parts (a) through (f) below. Age vs. HDL Cholesterol data Age, x HDL Cholesterol, y Age, x HDL Cholesterol, y 3838 5555 4040 4343 4141 5454 6767 6464 4747 3535 2929 5353 3232 5656 5050 3737 5454 3434 2626 4444 5252 3939 5151 3636 6060 4444 4747 5353 6161 3838 4040 2828 2626 4949 PrintDone view the data obtained by the doctor. obtained by the doctor is the in the data table below. Complete parts (a) through (f) below. LOADING... Click the icon to view the data obtained by the doctor. (a) Draw a scatter diagram of the data,…Rita is a runner. She records the amounts of time that it takes her to run different distances in the scatter plot below. Which statements are true? a) There is a least one outlier represented in the scatter plot. b) There is a linear association between distance and time in the scatter plot. c) There is a nonlinear association between distance and time in the scatter plot. d) There is a positive association between distance and time in the scatter plot. e) There is a negative association between dstance and time in the scatter plot.
- 1. Amanda Boleyn, an entrepreneur who recently sold her start-up for a multi-million-dollar sum, is looking for alternate investments for her newfound fortune. She is considering an investment in wine, similar to how some people invest in rare coins and fine art. To educate herself on the properties of fine wine, she has collected data on 13 different characteristics of 178 wines. Amanda has applied k-means clustering to this data for k = 1, ... , 10 and generated the following plot of total sums of squared deviations. After analyzing this plot, Amanda generates summaries for k = 2, 3, and 4. Which value of k is the most appropriate to categorize these wines? Justify your choice with calculations. Answer the following: Do not round intermediate calculations. If required, round your answers to two decimal places. k = Cluster 1 to Cluster 2 Distance / Cluster 1 Average Distance = Cluster 2 to Cluster 1 Distance / Cluster 2 Average Distance = Average = k = 3Cluster 1…Mercury is a persistent and dispersive environmental contaminantfound in many ecosystems around the world.When released as an industrial by-product, it often finds itsway into aquatic systems where it can have deleteriouseffects on various avian and aquatic species. The accompanyingdata on blood mercury concentration (mg/g) for adultfemales near contaminated rivers in Virginia was read froma graph in the article “Mercury Exposure Effects theReproductive Success of a Free-Living TerrestrialSongbird, the Carolina Wren” (The Auk, 2011: 759–769;this is a publication of the American Ornithologists’ Union)..20 .22 .25 .30 .34 .41 .55 .561.42 1.70 1.83 2.20 2.25 3.07 3.25a. Determine the values of the sample mean and samplemedian and explain why they are different.[Hint: ox1 5 18.55.]b. Determine the value of the 10% trimmed mean andcompare to the mean and median.c. By how much could the observation .20 be increasedwithout impacting the value of the sample median?This question is from the textbook and I had raised a request as the graph was not visible in your solution. The Cambridge Study in Delinquent Development was under-taken in north London to investigate the links between criminal behavior in young men and the socioeconomic factors of their upbringing. A cohort of 395 boys was followed for about 20 years, starting at the age of 8 or 9. The following table shows the total number of criminal convictions by the boys between the start and end of the study. Number of convictions Frequency 0 265 1 49 2 21 3 19 4 10 5 10 6 2 7 2 8 4 9 2 10 1 11 4 12 3 13 1 14 2 a) Display the frequency distribution in a graph. Which type of graph is most appropriate? (b) Describe the shape of the frequency distribution. Is it skewed or is it symmetric? If skewed, is it positively skewed or negatively skewed? Is it unimodal or bimodal? Are there outliers in the…