e) When comparing two quantitative variables when represented by a Boxplot, we select an option
e) When comparing two quantitative variables when represented by a Boxplot, we select an option

Glencoe Algebra 1, Student Edition, 9780079039897, 0079039898, 2018
18th Edition
ISBN:9780079039897
Author:Carter
Publisher:Carter
Chapter10: Statistics
Section10.4: Distributions Of Data
Problem 19PFA

Related questions
Question
Q 2 E please
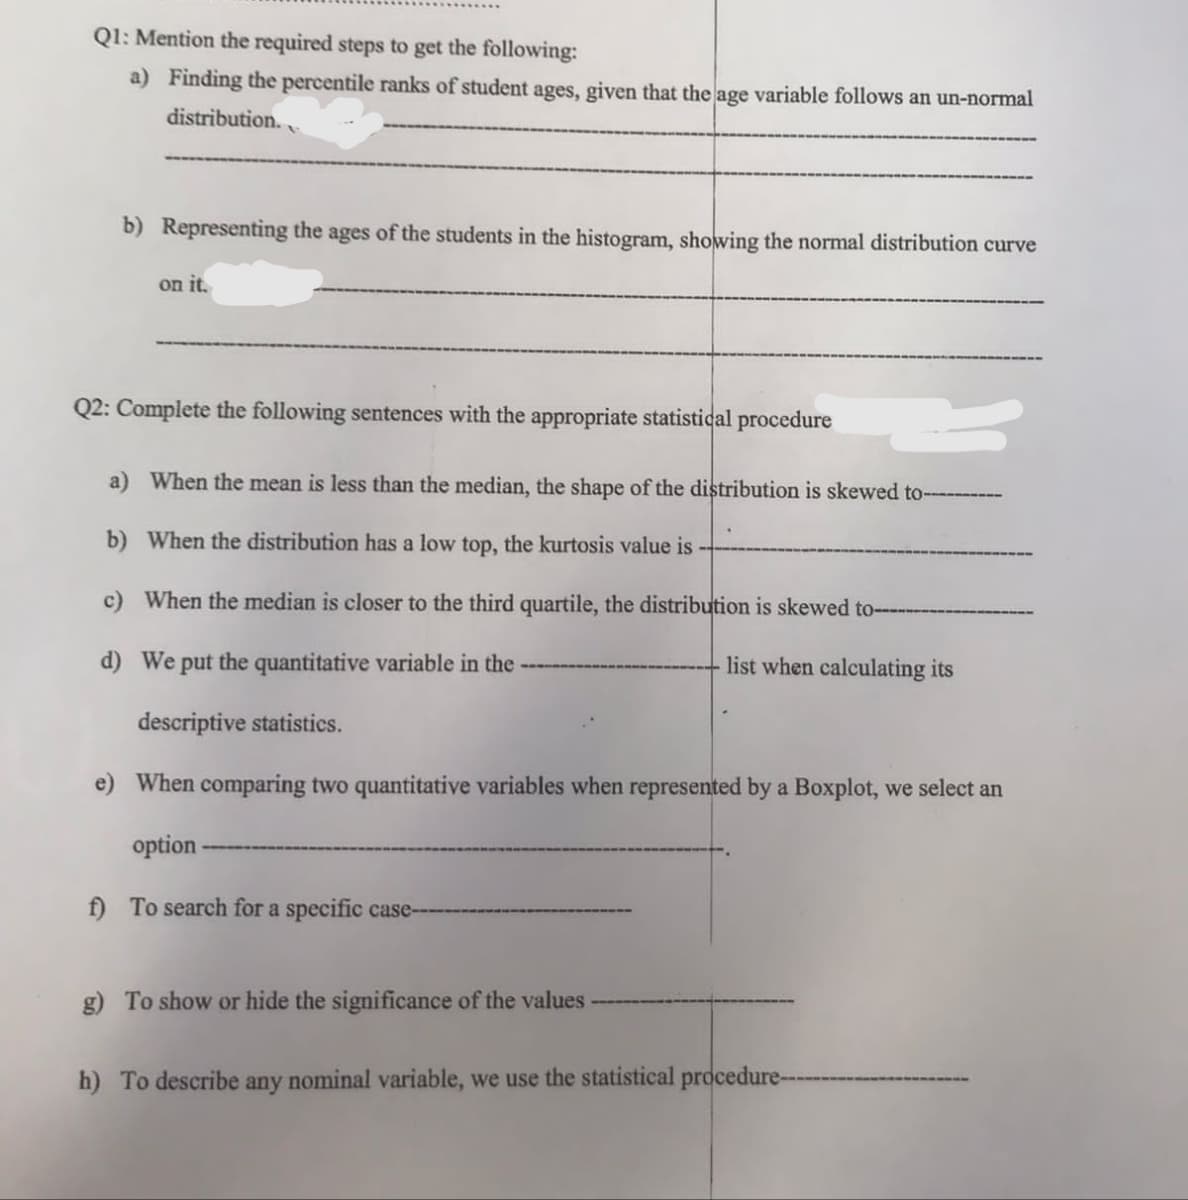
Transcribed Image Text:Q1: Mention the required steps to get the following:
a) Finding the percentile ranks of student ages, given that the age variable follows an un-normal
distribution..
b) Representing the ages of the students in the histogram, showing the normal distribution curve
on it.
Q2: Complete the following sentences with the appropriate statistical procedure
a) When the mean is less than the median, the shape of the distribution is skewed to----------
b) When the distribution has a low top, the kurtosis value is ---
c) When the median is closer to the third quartile, the distribution is skewed to-
d) We put the quantitative variable in the
list when calculating its
descriptive statistics.
e) When comparing two quantitative variables when represented by a Boxplot, we select an
option
f) To search for a specific case--
g) To show or hide the significance of the values
h) To describe any nominal variable, we use the statistical procedure--
Expert Solution
This question has been solved!
Explore an expertly crafted, step-by-step solution for a thorough understanding of key concepts.

Step by step
Solved in 2 steps with 2 images

Recommended textbooks for you
Glencoe Algebra 1, Student Edition, 9780079039897…
Algebra
ISBN:
9780079039897
Author:
Carter
Publisher:
McGraw Hill
Glencoe Algebra 1, Student Edition, 9780079039897…
Algebra
ISBN:
9780079039897
Author:
Carter
Publisher:
McGraw Hill