Suppose IQ scores were obtained for 20 randomly selected sets of siblings. The 20 pairs of measurements yield x = 104.02, y = 105, r=0.918, P-value=0.000, and y=5.66 +0.96x, where x represents the IQ score of the older child. Find the best predicted valu the older child has an IQ of 96? Use a significance level of 0.05. Click the icon to view the critical values of the Pearson correlation coefficient r. The best predicted value of ŷ is. (Round to two decimal places as needed.) Critical Values of the Pearson Correlation Coefficient r n 4 5 6 7 8 9 10 11 12 13 14 15 16 17 18 19 20 25 30 35 40 45 50 60 70 80 90 100 n Critical Values of the Pearson Correlation Coefficient r -0.05 0.950 0.878 0.811 0.754 0.707 0.666 0.632 0.602 0.576 0.553 0.532 0.514 0.497 0.482 0.468 0.456 0.444 0.396 0.361 0.335 0.312 0.294 0.279 0.254 0.236 0.220 0.207 0.196 -0.05 Print -0.01 0.990 0.959 0.917 0.875 0.834 0.798 0.765 0.735 0.708 0.684 0.661 0.641 0.623 0.606 0.590 0.575 0.561 0.505 0.463 0.430 0.402 0.378 0.361 0.330 0.305 0.286 0.269 0.256 -0.01 Done NOTE: To test Ho: p=0 against H,: p= 0, reject Ho if the absolute value of ris greater than the critical value in the table. X
Suppose IQ scores were obtained for 20 randomly selected sets of siblings. The 20 pairs of measurements yield x = 104.02, y = 105, r=0.918, P-value=0.000, and y=5.66 +0.96x, where x represents the IQ score of the older child. Find the best predicted valu the older child has an IQ of 96? Use a significance level of 0.05. Click the icon to view the critical values of the Pearson correlation coefficient r. The best predicted value of ŷ is. (Round to two decimal places as needed.) Critical Values of the Pearson Correlation Coefficient r n 4 5 6 7 8 9 10 11 12 13 14 15 16 17 18 19 20 25 30 35 40 45 50 60 70 80 90 100 n Critical Values of the Pearson Correlation Coefficient r -0.05 0.950 0.878 0.811 0.754 0.707 0.666 0.632 0.602 0.576 0.553 0.532 0.514 0.497 0.482 0.468 0.456 0.444 0.396 0.361 0.335 0.312 0.294 0.279 0.254 0.236 0.220 0.207 0.196 -0.05 Print -0.01 0.990 0.959 0.917 0.875 0.834 0.798 0.765 0.735 0.708 0.684 0.661 0.641 0.623 0.606 0.590 0.575 0.561 0.505 0.463 0.430 0.402 0.378 0.361 0.330 0.305 0.286 0.269 0.256 -0.01 Done NOTE: To test Ho: p=0 against H,: p= 0, reject Ho if the absolute value of ris greater than the critical value in the table. X

Glencoe Algebra 1, Student Edition, 9780079039897, 0079039898, 2018
18th Edition
ISBN:9780079039897
Author:Carter
Publisher:Carter
Chapter10: Statistics
Section10.3: Measures Of Spread
Problem 1GP

Related questions
Question
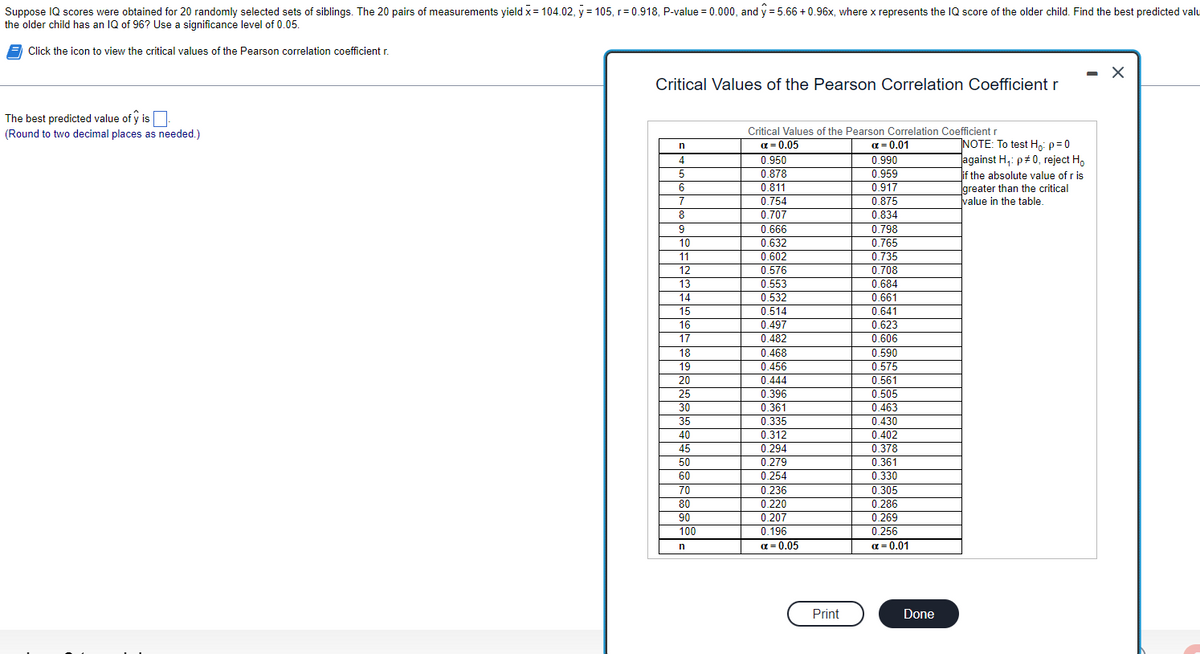
Transcribed Image Text:Suppose IQ scores were obtained for 20 randomly selected sets of siblings. The 20 pairs of measurements yield x= 104.02, y = 105, r=0.918, P-value = 0.000, and y = 5.66 +0.96x, where x represents the IQ score of the older child. Find the best predicted valu
the older child has an IQ of 96? Use a significance level of 0.05.
Click the icon to view the critical values of the Pearson correlation coefficient r.
The best predicted value of ŷ is.
(Round to two decimal places as needed.)
Critical Values of the Pearson Correlation Coefficient r
n
4
5
6
7
8
9
10
11
12
13
14
15
16
17
18
19
20
25
30
35
40
45
50
60
70
80
90
100
n
Critical Values of the Pearson Correlation Coefficient r
α = 0.05
α = 0.01
0.950
0.878
0.811
0.754
0.707
0.666
0.632
0.602
0.576
0.553
0.532
0.514
0.497
0.482
0.468
0.456
0.444
0.396
0.361
0.335
0.312
0.294
0.279
0.254
0.236
0.220
0.207
0.196
α = 0.05
Print
0.990
0.959
0.917
0.875
0.834
0.798
0.765
0.735
0.708
0.684
0.661
0.641
0.623
0.606
0.590
0.575
0.561
0.505
0.463
0.430
0.402
0.378
0.361
0.330
0.305
0.286
0.269
0.256
α=0.01
Done
NOTE: To test Ho: p=0
against H₁: p= 0, reject Ho
if the absolute value of r is
greater than the critical
value in the table.
- X
Expert Solution
This question has been solved!
Explore an expertly crafted, step-by-step solution for a thorough understanding of key concepts.

Step by step
Solved in 6 steps with 1 images

Recommended textbooks for you
Glencoe Algebra 1, Student Edition, 9780079039897…
Algebra
ISBN:
9780079039897
Author:
Carter
Publisher:
McGraw Hill
Glencoe Algebra 1, Student Edition, 9780079039897…
Algebra
ISBN:
9780079039897
Author:
Carter
Publisher:
McGraw Hill