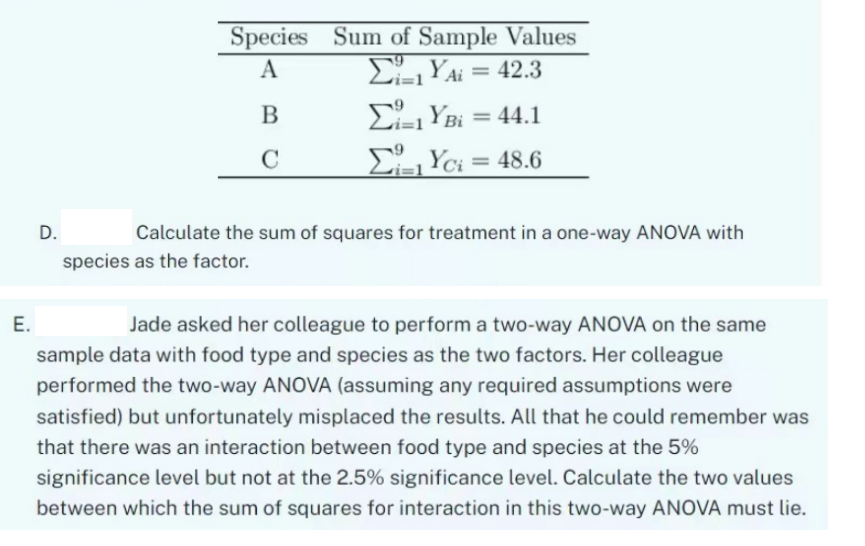
E. D. A Species Sum of Sample Values ΣYA = 42.3 Σi=1 YBi = 44.1 Yoi = 48.6 B C Calculate the sum of squares for treatment in a one-way ANOVA with species as the factor. Jade asked her colleague to perform a two-way ANOVA on the same sample data with food type and species as the two factors. Her colleague performed the two-way ANOVA (assuming any required assumptions were satisfied) but unfortunately misplaced the results. All that he could remember was that there was an interaction between food type and species at the 5% significance level but not at the 2.5% significance level. Calculate the two values between which the sum of squares for interaction in this two-way ANOVA must lie.
Q: Exercise 22.12. [3, p.310] Maximum likelihood fitting of an exponential-family model. Assume that a…
A: To find the maximum-likelihood parameters , we need to maximize the log likelihood function. The log…
Q: The distribution of the tuitions, fees, and room and board charges of a random sample of public…
A: The question is about frequency distributionGiven :From pie chart :To find :1 ) Freq. dist.2 )…
Q: The distribution of the tuitions, fees, and room and board charges of a random sample of public…
A: The corresponding positive whole number, that is provided values of the pie chart is interpreted as…
Q: You are playing a card came, and the probability that you will win a game is p = 0.78. If you play…
A: P(win game) = p = 0.78sample size (n) = 1290x = no. of times game wonfind mean, standard deviation…
Q: 6. The mean grade of 10 students is 86. Accidentally, after computing the mean, the teacher erased…
A: “Since you have posted multiple questions, we will provide the solution only to the first question…
Q: Consider the AR(1) model, x, --₁x₁_₁+₁ μ=z₁ with ₁ = 0.6, p=9, o? = 0.1 X100 = 8.9, X99 = 9, X98 = 9…
A: a) To calculate , we need to use the given values and the AR(1) model:where: represents the value at…
Q: Annual high temperatures in a certain location have been tracked for several years. Let X represent…
A:
Q: 729 converges to a in probability (Hint: apply the erges to a in probability, but not in the mean
A: *Answer:*aTo show that convergence in the mean square sense implies convergence in probability, we…
Q: A boxplot for a set of data is given below. Find the five-number summary Find the minimum: Find Q₁:…
A: A boxplot for a data set is given.
Q: The accompanying table shows the numbers of male and female students in a particular country who…
A: The question is about conditional probabilityGiven :To find :a ) Prob. that a rand. selected student…
Q: True or false? Given that a confidence interval for µ is 13 + The value of 13 in this expression…
A: Confidence interval for is 13+
Q: Bill and Chris are playing a game that involves a spinner. They have observed the following facts…
A: Following the conditions of the spinner (where four outcome numbers are equally likely), consider…
Q: Doug was the friend that told Phil (from Question 1) that he drinks too much coffee. It turns out…
A: Given the joint probability distribution between the number of coffees and the number of SportsCaf…
Q: As the supervisor in charge of shipping and receiving, you need to determine the average outgoing…
A: From the given information, the average defective rate (p) is 0.04.
Q: 12. Counting: Outcomes You toss a pair of dice. (a) Determine the number of possible pairs of…
A: Each dice has 6 possible outcomes. Therefore, total pair of outcomes are given…
Q: Which of the following regression equations could be depicted in the picture below? (Hint: Pay…
A: The regression equation is used for prediction. It is an equation made up of independent and…
Q: How many bags of candy had between 30 and 40 orange candies? A candy dispenser put various numbers…
A: Here, we have given the stem and leaf display and then we have to find how many bags of candy had…
Q: Q5: Let X₁, X2, ..., X, be a random sample with size n from n(0, 1). Show that the likelihood ratio…
A: To determine the likelihood ratio for the given hypothesis test, we first need to calculate the…
Q: The Third National Health and Nutrition Examination Survey was conducted in the United States in the…
A: The odds ratio shows the measure of association b/w an exposure and an outcome.
Q: Match each scatterplot shown below with one of the four specified correlations. O a. -0.89 b. -0.12…
A: The scatterplots and correlation coefficients are given.
Q: 20) Assume that hybridization experiments are conducted with peas having the property that for…
A: Let X be the random variable from binomial distribution with Probability (p) = 0.75 and sample size…
Q: As shown above, a classic deck of cards is made up of 52 cards, 26 are black, 26 are red. Each color…
A: Given:n(S)=52
Q: The frequency distribution below summarizes the home sale prices in the city of Summerhill for the…
A: According to the given information in this questionWe need to find the class midpoint of 142.0 to…
Q: 25. Counting: Hiring There are 15 qualified applicants for 5 trainee positions in a fast-food…
A: Total number of applicants (n) = 15Total number of trainee positions (x) = 5
Q: Find the mean
A: Consider the preliminary calculations given below:Daily low temperaturefrequency (f)Mid value (m)…
Q: wo dice are rolled and what is the probability that the sum is 7?
A: Two dice are rolled
Q: Each family in Green Country is classified as living in an urban, rural, or suburban location.…
A:
Q: Undercoverage Social desirability bias Nonresponse bias Acquiescence bias A survey asking how often…
A: Extreme responding: The majority of reviews on a restaurant's social media site are either one-star…
Q: Find the median of the following data set 25 24 21 13 14 15 none of these O 15 18 21 17 bp
A: The data set :-X :- 25, 24, 21, 13, 14, 15Then,We will find the Median (M) = ?
Q: Given the Academic Performance and number of hours studying daily of 10 randomly selected students…
A: Spearman rank-order correlationSort the data on X from lowest to highest and rank them from 1 to 10…
Q: Animals and people that take in more energy than they expend will get fatter. Here are data on 12…
A: Given:The data of the body mass and energy of Lean and obese monkeys is provided…
Q: Data in the table comes from the NASA Global Climate Change website. It gives the average global…
A: YearTemp19840.1619860.1819880.3819900.4519920.2219940.3119960.3319980.6120000.420020.6320040.5420060…
Q: 2.)Use the following data where Y is the dependent and X is the independent variable: SALES…
A: Let there exist two numerical variables.The association between such variables can be obtained using…
Q: e accompanying frequency distribution represents the square footage of a random sample of 500 houses…
A: Square…
Q: Listed below are the ages of 11 players randomly selected from the roster of a championship sports…
A: The question is about measuresGiven :To find :a ) Meanb ) Medianc ) Moded ) Midrangee ) how the…
Q: Discuss how correlation and analysis of multiple sources of data can impact organizational…
A: The data refers to the collection of information which is used for analysis.
Q: 5. The systolic blood pressure (measured in mmHg) of adult males follows a normal distribution with…
A: Let, x denotes the systolic blood pressure of adult males and it is given that-So,
Q: The data in the table below shows the times (in days) that an artist spent recording an album and…
A: (a) Here, the scatter plot is given for score obtained vs the time taken to create the albumHere,…
Q: Let X1,...,Xn be a sample from normal with mean theta and variance 1. Construct an unbiased…
A: We are given a random sample X1, X2, ..., Xn from a normal distribution with mean θ and variance 1.…
Q: Elina has measured the heights (in cm) of 800 adults from Chile, 400 women and 400 men. She wants to…
A: The Minitab results are obtained as-W-valuep-value1260520.0000
Q: Question 17 The following table shows retail sales in drug stores in billions of dollars in the U.S.…
A: Year (1995 is denoted by 0) Year : { 0 to 15 } Retail sales : { 85.851,.....222.266 } Linear…
Q: 1. Getting a good night's sleep is essential for teenage students to perform optimally during…
A: a) Here are the null and alternative hypotheses stated :Null hypothesis (H₀): The population mean…
Q: SOLVE STEP BY STEP IN DIGITAL FORMAT 1.- The following data refer to the weight loss of certain…
A: Three different lubricants were used under controlled conditions: Lubric ALubric BLubric…
Q: Which of the following statements are true? There may be more than one correct statement; check all…
A: The true statement(s) has to be identified.
Q: Select the correct statement about the mean and median for the histogram below. 150 r 50 T 0 95 15…
A: The mean value and the median value gives an idea about the central value of the data.
Q: Find the area under the standard normal curve to the right of z = 0.74. Round your answer to four…
A:
Q: Suppose that the mean cranial capacity for men is 1020 cc (cubic centimeters) and that the standard…
A: The mean cranial capacity for men is 1020 cc (cubic centimeters) and that the standard deviation is…
Q: The table gives the round-trip fare for flights between Boston and some other cities on major…
A: The provided data is inserted in the tabulated format as follows:CityMiles (x)Cost (y)New…
Q: Three experiments investigating the relation between need for cognitive closure and persuasion were…
A: Mean score= 175Standard deviation=7.55Margin of error =1.5Confidence level=99%
Q: A researcher wishes to examine the relationship between years of schooling completed and the number…
A: given regression equation is =4-5xx is the number of years of schooling completed y is the number of…
Trending now
This is a popular solution!
Step by step
Solved in 5 steps with 58 images
- A) For r=0.7789 and sample size= 10, the corresponding t value is? B) For t=2.778 and sample size = 8, the corresponding r value is? C) SSR in linear regression is equal to? D) Familywise error rate for 5 samples from 5 independent populations with 99% CI, is? E) Sampling error in an infertial statistics problem can be over come by? F) In regression analysis if SSR = 20.213 and SST = 43.214 then linearity between variables is equal to?Wild irises are beautiful flowers found throughout the United States, Canada, and northern Europe. This problem concerns the length of the sepal (leaf-like part covering the flower) of different species of wild iris. Data are based on information taken from an article by R. A. Fisher in Annals of Eugenics (Vol. 7, part 2, pp. 179 -188). Measurements of sepal length in centimeters from random samples of Iris setosa (I), Iris versicolor (II), and Iris virginica (III) are as follows below. I II III 5.5 5.2 6.7 4.4 6.5 5.7 5.2 6.9 4.1 5.9 4.4 7.8 4.3 5.5 5.7 5.3 6.4 6.1 5.8 5.5 6.9 Shall we reject or not reject the claim that there are no differences among the population means of sepal length for the different species of iris? Use a 10% level of significance. (a) What is the level of significance? (b) Find SSTOT, SSBET, and SSW and check that SSTOT = SSBET + SSW. (Use 3 decimal places.) SSTOT = ? SSBET = ? SSW = ? Find d.f.BET, d.f.W, MSBET, and…Wild irises are beautiful flowers found throughout the United States, Canada, and northern Europe. This problem concerns the length of the sepal (leaf-like part covering the flower) of different species of wild iris. Data are based on information taken from an article by R. A. Fisher in Annals of Eugenics (Vol. 7, part 2, pp. 179 -188). Measurements of sepal length in centimeters from random samples of Iris setosa (I), Iris versicolor (II), and Iris virginica (III) are as follows below. I II III 5.5 5.2 6.8 4.6 6.5 5.3 5.1 6.1 4.4 5.5 4.1 7.9 4.1 5.1 5.9 5.4 6.1 6.9 5.4 5.1 6.6 Shall we reject or not reject the claim that there are no differences among the population means of sepal length for the different species of iris? Use a 5% level of significance. (a) What is the level of significance?State the null and alternate hypotheses. Ho: ?1 = ?2 = ?3; H1: Exactly two means are equal.Ho: ?1 = ?2 = ?3; H1: Not all the means are equal. Ho: ?1 = ?2 = ?3; H1:…
- Wild irises are beautiful flowers found throughout the United States, Canada, and northern Europe. This problem concerns the length of the sepal (leaf-like part covering the flower) of different species of wild iris. Data are based on information taken from an article by R. A. Fisher in Annals of Eugenics (Vol. 7, part 2, pp. 179 -188). Measurements of sepal length in centimeters from random samples of Iris setosa (I), Iris versicolor (II), and Iris virginica (III) are as follows below. I II III 5.7 5.4 6.8 4.1 6.3 5.4 5.0 6.7 4.4 5.4 4.3 7.3 4.6 5.5 5.3 5.7 6.5 6.7 5.2 5.3 6.8 Shall we reject or not reject the claim that there are no differences among the population means of sepal length for the different species of iris? Use a 5% level of significance. (a) What is the level of significance?State the null and alternate hypotheses. Ho: ?1 = ?2 = ?3; H1: All three means are different.Ho: ?1 = ?2 = ?3; H1: Not all the means are equal. Ho: ?1 = ?2 = ?3;…Wild irises are beautiful flowers found throughout the United States, Canada, and northern Europe. This problem concerns the length of the sepal (leaf-like part covering the flower) of different species of wild iris. Data are based on information taken from an article by R. A. Fisher in Annals of Eugenics (Vol. 7, part 2, pp. 179 -188). Measurements of sepal length in centimeters from random samples of Iris setosa (I), Iris versicolor (II), and Iris virginica (III) are as follows below. I II III 5.7 5.1 6.5 4.7 6.2 5.1 4.7 6.6 4.7 5.8 4.9 7.5 4.6 5.2 5.3 5.3 6.2 6.2 5.4 5.8 6.4 (b) Find SSTOT, SSBET, and SSW and check that SSTOT = SSBET + SSW. (Use 3 decimal places.) SSTOT = SSBET = SSW = Find d.f.BET, d.f.W, MSBET, and MSW. (Use 4 decimal places for MSBET, and MSW.) dfBET = dfW = MSBET = MSW = Find the value of the sample F statistic. (Use 2 decimal places.)What are the degrees of freedom? (numerator) (denominator)Wild irises are beautiful flowers found throughout the United States, Canada, and northern Europe. This problem concerns the length of the sepal (leaf-like part covering the flower) of different species of wild iris. Data are based on information taken from an article by R. A. Fisher in Annals of Eugenics (Vol. 7, part 2, pp. 179 -188). Measurements of sepal length in centimeters from random samples of Iris setosa (I), Iris versicolor (II), and Iris virginica (III) are as follows below. I II III 5.9 5.8 6.9 4.8 6.5 5.6 4.6 6.4 4.9 5.7 4.3 7.7 4.8 5.8 5.6 5.4 6.3 6.3 5.8 5.5 6.6 Shall we reject or not reject the claim that there are no differences among the population means of sepal length for the different species of iris? Use a 5% level of significance. (b) Find SSTOT, SSBET, and SSW and check that SSTOT = SSBET + SSW. (Use 3 decimal places.) SSTOT = SSBET = SSW = Find d.f.BET, d.f.W, MSBET, and MSW. (Use 4 decimal places for MSBET, and…
- Wild irises are beautiful flowers found throughout the United States, Canada, and northern Europe. This problem concerns the length of the sepal (leaf-like part covering the flower) of different species of wild iris. Data are based on information taken from an article by R. A. Fisher in Annals of Eugenics (Vol. 7, part 2, pp. 179 -188). Measurements of sepal length in centimeters from random samples of Iris setosa (I), Iris versicolor (II), and Iris virginica (III) are as follows below. I II III 5.6 5.5 6.9 4.5 6.6 5.5 5.4 6.5 4.3 5.4 4.6 7.9 4.7 5.6 5.8 5.9 6.6 6.3 5.6 5.6 6.9 Shall we reject or not reject the claim that there are no differences among the population means of sepal length for the different species of iris? (b) Find SSTOT, SSBET, and SSW and check that SSTOT = SSBET + SSW. (Use 3 decimal places.) SSTOT = SSBET = SSW = Find d.f.BET, d.f.W, MSBET, and MSW. (Use 4 decimal places for MSBET, and MSW.) dfBET = dfW =…answer b The following table shows the number of shirts by sizes that are manufactured in a factory on aparticular week:Extra Small Small Medium Large Extra Large390 470 520 680 440a) It was discovered that the sizing of some shirts was labelled incorrectly.(i) Give two reasons why it would be necessary to examine a sample of the shirts producedrather than examine the entire weekly production. (ii) State two differences between a cluster sample and a stratified random sample in thissituation. (iii) Using the stratified random sampling technique, calculate the number of medium shirtsthat will be selected if we require a sample of 375 shirts. (iv)State one advantage of using stratified random method for collecting this sample. b) Determine the level of measurement that describes the following (i) The size of the shirt that a customer purchase(ii) The total amount paid by the customer(iii) The address of the factory that manufactures the shirts