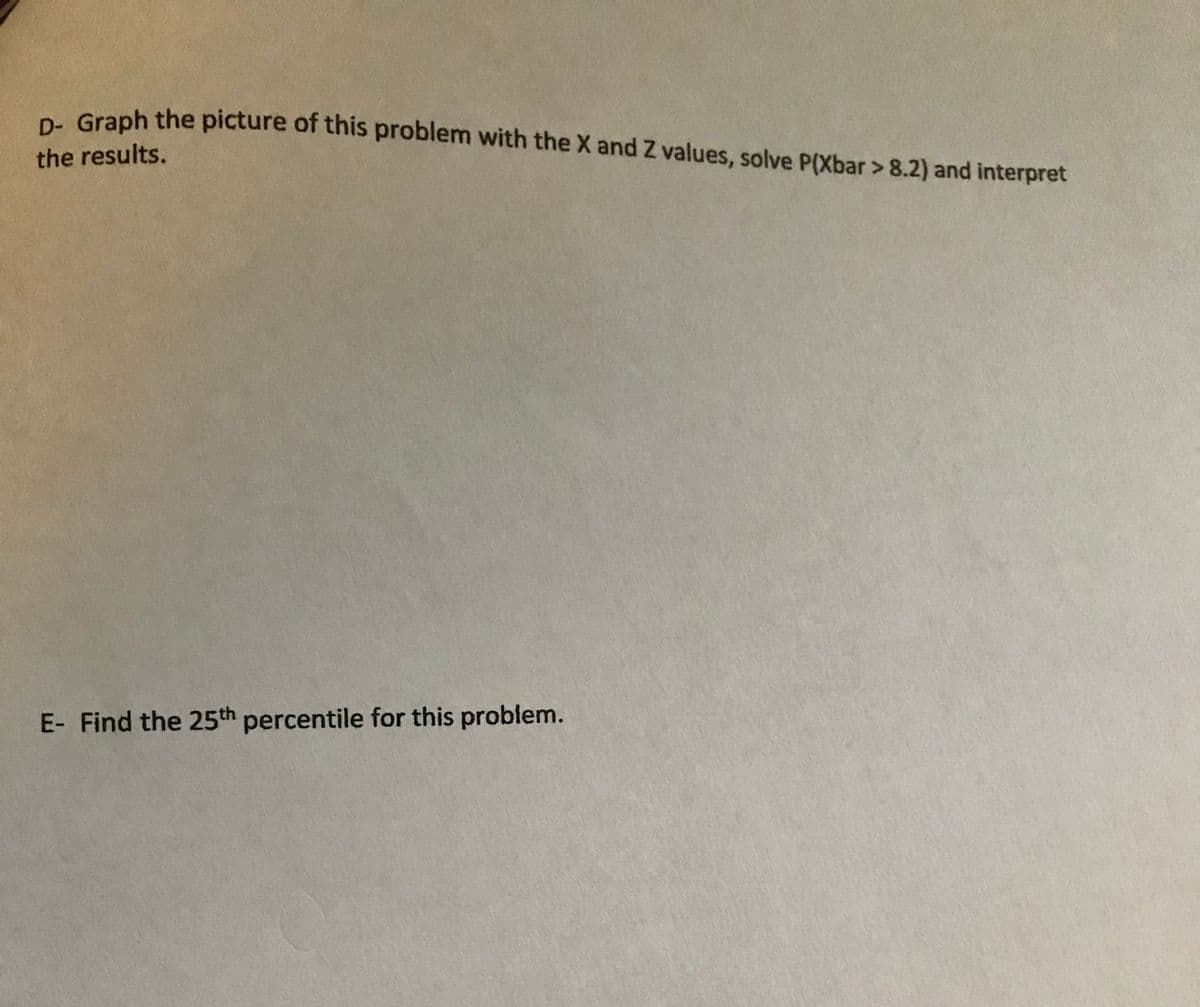
e. Graph the picture of this problem with the X and Z values, solve P(Xbar > 8.2) and interpret the results. E- Find the 25th percentile for this problem.
e. Graph the picture of this problem with the X and Z values, solve P(Xbar > 8.2) and interpret the results. E- Find the 25th percentile for this problem.
Chapter8: Sequences, Series,and Probability
Section8.7: Probability
Problem 11ECP: A manufacturer has determined that a machine averages one faulty unit for every 500 it produces....
Related questions
Question

Transcribed Image Text:e Graph the picture of this problem with the X and Z values, solve P(Xbar > 8.2) and interpret
the results.
E- Find the 25th percentile for this problem.

Transcribed Image Text:8- A car rental company finds that among drivers who go over their mile driving limit go over their
limit by an average 4.5 miles with a standard deviation of 1.2 miles. You conduct a survey of 49
customers. You want to know the probability that the average drivers drove more than 5 miles or
P(Xbar > 5)
Expert Solution
This question has been solved!
Explore an expertly crafted, step-by-step solution for a thorough understanding of key concepts.
Step by step
Solved in 3 steps with 2 images

Knowledge Booster
Learn more about
Need a deep-dive on the concept behind this application? Look no further. Learn more about this topic, statistics and related others by exploring similar questions and additional content below.Recommended textbooks for you


College Algebra
Algebra
ISBN:
9781305115545
Author:
James Stewart, Lothar Redlin, Saleem Watson
Publisher:
Cengage Learning


College Algebra
Algebra
ISBN:
9781305115545
Author:
James Stewart, Lothar Redlin, Saleem Watson
Publisher:
Cengage Learning