e. The p-value is ? f. Based on this, we should Select an answer O the null hypothesis. g. Thus, the final conclusion is that ... The data suggest the populaton proportion is significantly different from 50% at a = 0.05, so there is sufficient evidence to conclude that the proportion of voters who prefer the Democratic candidate is different from 50% The data suggest the population proportion is not significantly different from 50% at a = 0.05, so there is sufficient evidence to conclude that the proportion of voters who prefer the Democratic candidate is equal to 50%. The data suggest the population proportion is not significantly different from 50% at a = 0.05, so there is not sufficient evidence to conclude that the proportion of voters who prefer the Democratic candidate is different from 50%. h. Interpret the p-value in the context of the study. Olf the sample proportion of voters who prefer the Democratic candidate is 56% and if another 100 voters are surveyed then there would be a 23.02% chance that we would conclude either fewer than 50% of all voters prefer the Democratic candidate or more than 50% of all voters prefer the Democratic candidate. There is a 23.02% chance that the percent of all voters who prefer the Democratic candidate differs from 50%.
e. The p-value is ? f. Based on this, we should Select an answer O the null hypothesis. g. Thus, the final conclusion is that ... The data suggest the populaton proportion is significantly different from 50% at a = 0.05, so there is sufficient evidence to conclude that the proportion of voters who prefer the Democratic candidate is different from 50% The data suggest the population proportion is not significantly different from 50% at a = 0.05, so there is sufficient evidence to conclude that the proportion of voters who prefer the Democratic candidate is equal to 50%. The data suggest the population proportion is not significantly different from 50% at a = 0.05, so there is not sufficient evidence to conclude that the proportion of voters who prefer the Democratic candidate is different from 50%. h. Interpret the p-value in the context of the study. Olf the sample proportion of voters who prefer the Democratic candidate is 56% and if another 100 voters are surveyed then there would be a 23.02% chance that we would conclude either fewer than 50% of all voters prefer the Democratic candidate or more than 50% of all voters prefer the Democratic candidate. There is a 23.02% chance that the percent of all voters who prefer the Democratic candidate differs from 50%.

Holt Mcdougal Larson Pre-algebra: Student Edition 2012
1st Edition
ISBN:9780547587776
Author:HOLT MCDOUGAL
Publisher:HOLT MCDOUGAL
Chapter11: Data Analysis And Probability
Section: Chapter Questions
Problem 8CR

Related questions

Concept explainers
Transformation of Graphs
The word ‘transformation’ means modification. Transformation of the graph of a function is a process by which we modify or change the original graph and make a new graph.
Exponential Functions
The exponential function is a type of mathematical function which is used in real-world contexts. It helps to find out the exponential decay model or exponential growth model, in mathematical models. In this topic, we will understand descriptive rules, concepts, structures, graphs, interpreter series, work formulas, and examples of functions involving exponents.
Question
NEED HELP WITh: E, F G,H, I
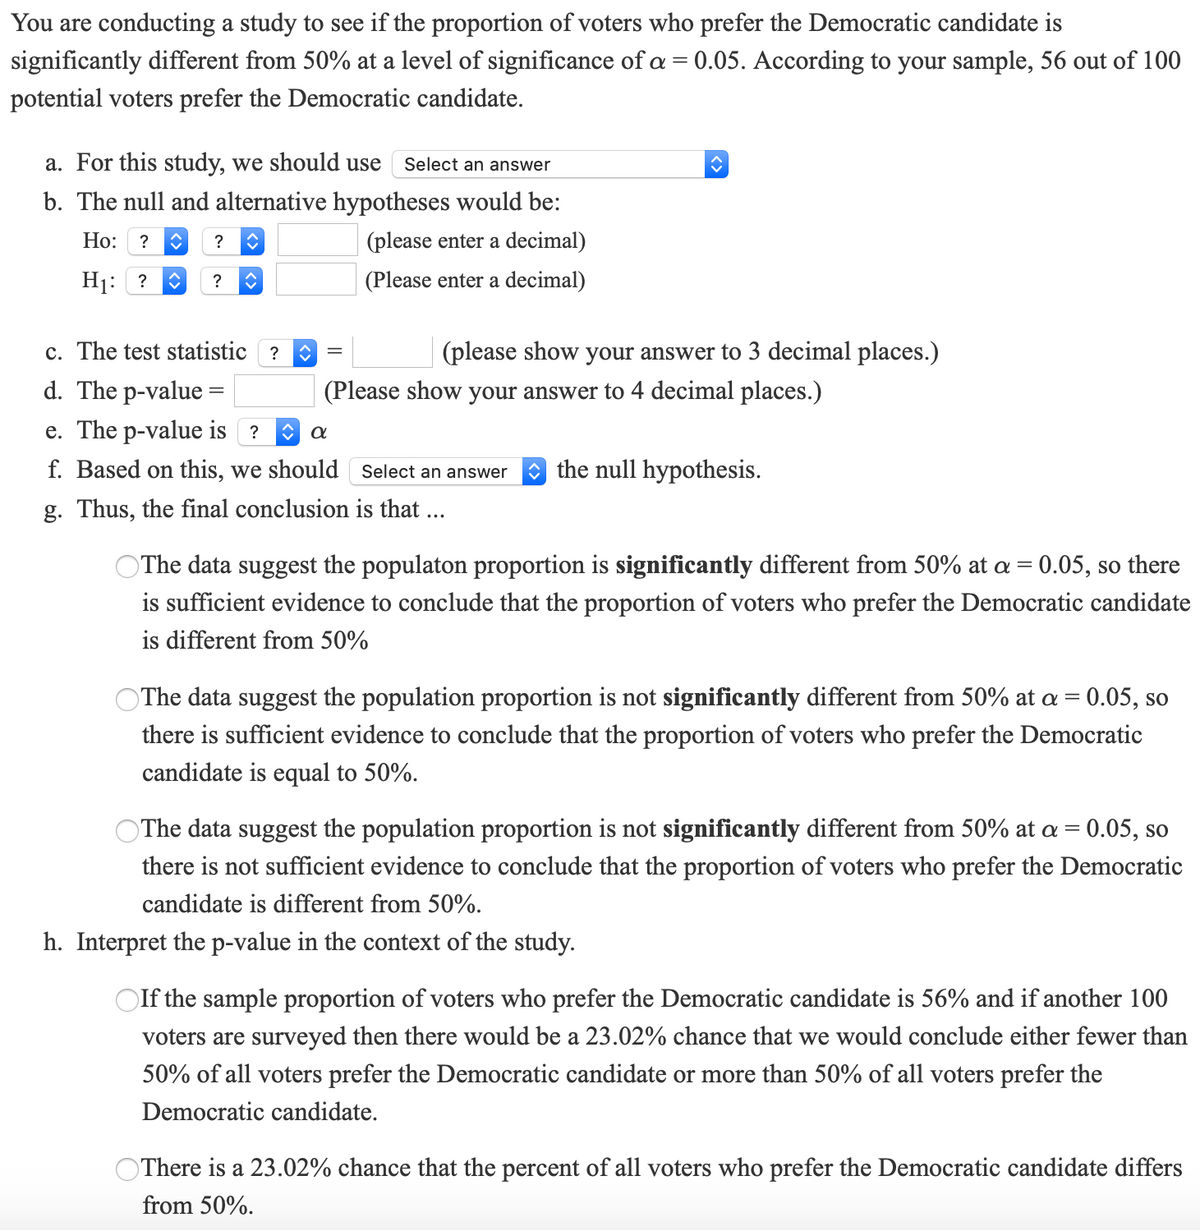
Transcribed Image Text:You are conducting a study to see if the proportion of voters who prefer the Democratic candidate is
significantly different from 50% at a level of significance of a = 0.05. According to your sample, 56 out of 100
potential voters prefer the Democratic candidate.
a. For this study, we should use
Select an answer
b. The null and alternative hypotheses would be:
Ho:
? O
?
(please enter a decimal)
H1: ?
(Please enter a decimal)
?
c. The test statistic ?
(please show your answer to 3 decimal places.)
d. The p-value =
(Please show your answer to 4 decimal places.)
e. The p-value is ?
f. Based on this, we should Select an answer
O the null hypothesis.
g. Thus, the final conclusion is that ...
OThe data suggest the populaton proportion is significantly different from 50% at a = 0.05, so there
is sufficient evidence to conclude that the proportion of voters who prefer the Democratic candidate
is different from 50%
OThe data suggest the population proportion is not significantly different from 50% at a = 0.05, so
there is sufficient evidence to conclude that the proportion of voters who prefer the Democratic
candidate is equal to 50%.
OThe data suggest the population proportion is not significantly different from 50% at a = 0.05, so
there is not sufficient evidence to conclude that the proportion of voters who prefer the Democratic
candidate is different from 50%.
h. Interpret the p-value in the context of the study.
OIf the sample proportion of voters who prefer the Democratic candidate is 56% and if another 100
voters are surveyed then there would be a 23.02% chance that we would conclude either fewer than
50% of all voters prefer the Democratic candidate or more than 50% of all voters prefer the
Democratic candidate.
OThere is a 23.02% chance that the percent of all voters who prefer the Democratic candidate differs
from 50%.
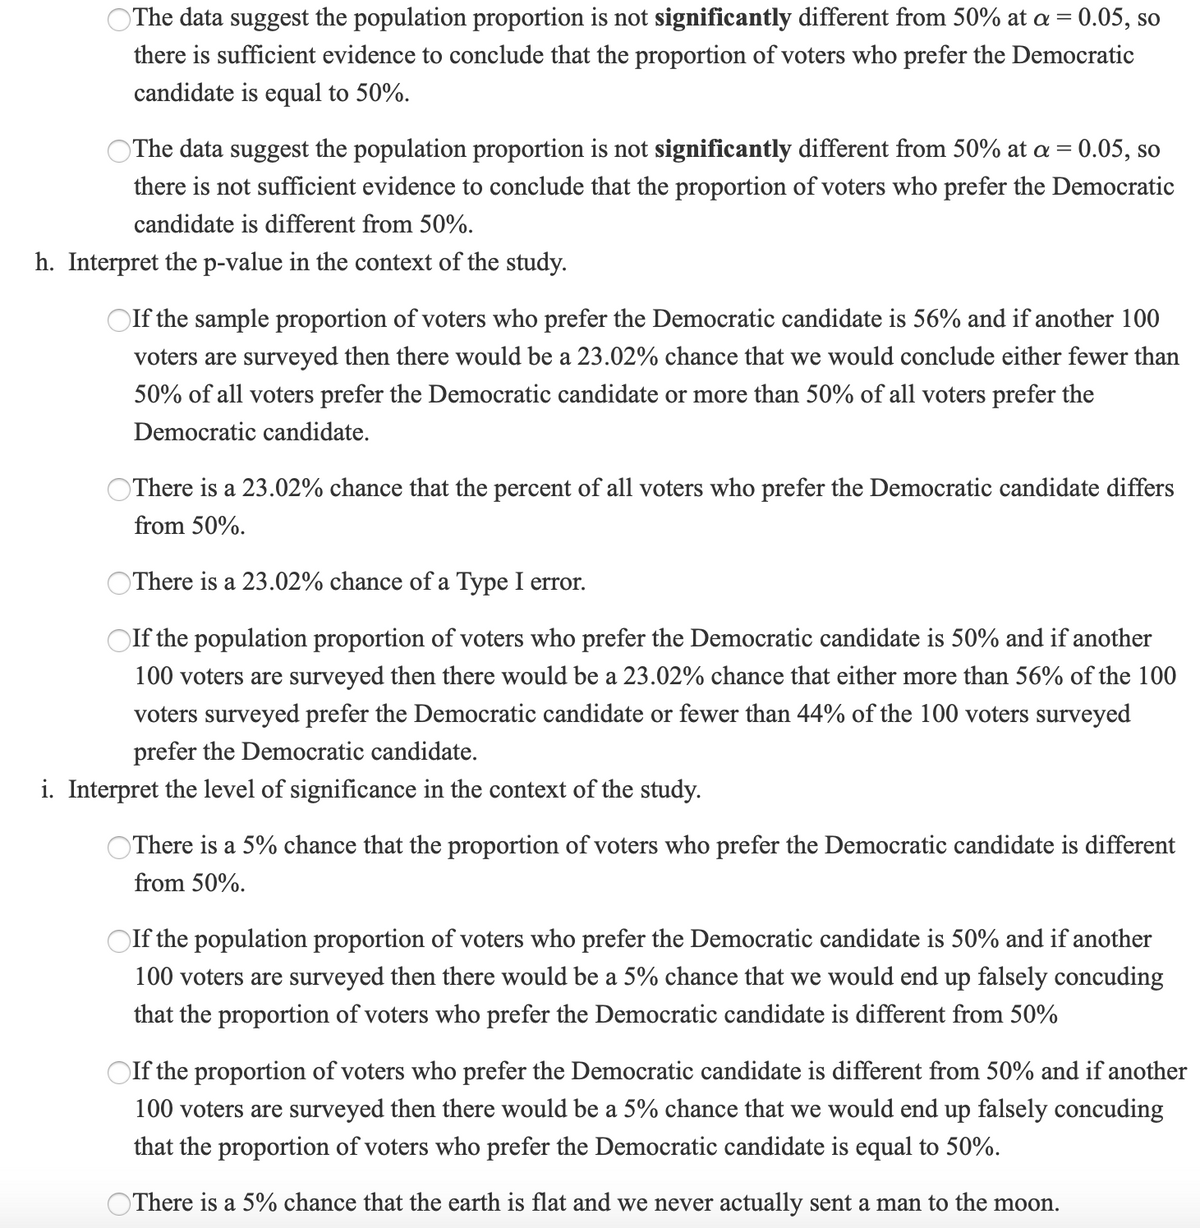
Transcribed Image Text:OThe data suggest the population proportion is not significantly different from 50% at a= 0.05, so
there is sufficient evidence to conclude that the proportion of voters who prefer the Democratic
candidate is equal to 50%.
The data suggest the population proportion is not significantly different from 50% at a = 0.05, so
there is not sufficient evidence to conclude that the proportion of voters who prefer the Democratic
candidate is different from 50%.
h. Interpret the p-value in the context of the study.
Olf the sample proportion of voters who prefer the Democratic candidate is 56% and if another 100
voters are surveyed then there would be a 23.02% chance that we would conclude either fewer than
50% of all voters prefer the Democratic candidate or more than 50% of all voters prefer the
Democratic candidate.
There is a 23.02% chance that the percent of all voters who prefer the Democratic candidate differs
from 50%.
OThere is a 23.02% chance of a Type I error.
OIf the population proportion of voters who prefer the Democratic candidate is 50% and if another
100 voters are surveyed then there would be a 23.02% chance that either more than 56% of the 100
voters surveyed prefer the Democratic candidate or fewer than 44% of the 100 voters surveyed
prefer the Democratic candidate.
i. Interpret the level of significance in the context of the study.
There is a 5% chance that the proportion of voters who prefer the Democratic candidate is different
from 50%.
If the population proportion of voters who prefer the Democratic candidate is 50% and if another
100 voters are surveyed then there would be a 5% chance that we would end up falsely concuding
that the proportion of voters who prefer the Democratic candidate is different from 50%
OIf the proportion of voters who prefer the Democratic candidate is different from 50% and if another
100 voters are surveyed then there would be a 5% chance that we would end up falsely concuding
that the proportion of voters who prefer the Democratic candidate is equal to 50%.
OThere is a 5% chance that the earth is flat and we never actually sent a man to the moon.
Expert Solution
This question has been solved!
Explore an expertly crafted, step-by-step solution for a thorough understanding of key concepts.

Step by step
Solved in 3 steps with 3 images

Knowledge Booster


Learn more about
Need a deep-dive on the concept behind this application? Look no further. Learn more about this topic, statistics and related others by exploring similar questions and additional content below.Recommended textbooks for you
Holt Mcdougal Larson Pre-algebra: Student Edition…
Algebra
ISBN:
9780547587776
Author:
HOLT MCDOUGAL
Publisher:
HOLT MCDOUGAL
Holt Mcdougal Larson Pre-algebra: Student Edition…
Algebra
ISBN:
9780547587776
Author:
HOLT MCDOUGAL
Publisher:
HOLT MCDOUGAL