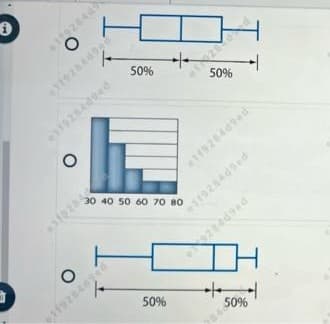
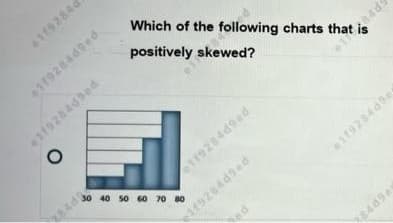
e1f9284d9ed 11928449ed O Which of the following charts that is positively skewed? 192849ad 1928449ed 30 40 50 60 70 80 1192840


Q: Match each scatterplot shown below with one of the four specified correlations.
A: Given: Scatter plot with correlation coefficient Match the correlation coefficient with the…
Q: Which of the following is the best level of significance for hypothesis testing? a. 0.10 b. 0.05…
A: The objective is to find out the best level of significance for hypothesis testing.
Q: You are testing the claim that the mean GPA of night students is greater than the mean GPA of day…
A: Givenn1=55x1=2.28s1=0.7 n2=50x2=2.72s2=0.72the claim that the mean GPA of night students is greater…
Q: According to the IRS, individuals filing federal income tax returns prior to March 31 received an…
A:
Q: A student researcher was surprised to learn that the 2017 NCAA Student-Athlete Substance Use Survey…
A: Since the question to be answered is not specified, we'll be answering only the first question.…
Q: A tea shop has relocated to a new area and wants to make sure that all tea cups are consistent in…
A: Given: Sample mean x¯ =4.6 Sample standard deviation (s) = 0.80 Hypothesized mean μ=4 Sample size…
Q: Use the formula FV = PMT(1+i)"-1
A:
Q: The regression equation to predict the total world gross ticket sales from the opening weekend…
A: Scatter plot is used to study linear relationship between two quantitative variables.
Q: The US Department of Energy reported that 52% of homes were heated by natural gas. A random sample…
A:
Q: Can smoking negatively affect one's ability to become pregnant? A study collected data on 654 women…
A: Given Total collected data 654
Q: X₁ + X₂ Q2: Let X₁-G(4,3) and X₂G(2,3) by mgf find dist. of Y=X₁ +X₂. ===
A:
Q: Question 7: Based on the data shown below, calculate the regression line (each value to at least two…
A: Given: Sample size(n)=8∑x=44∑y=107.2∑x2=284∑y2=1501.86∑xy=640.1
Q: Statistics and Probability Directions: Solve the problem below. Show your detailed solution.…
A:
Q: The operations manager in a company that manufactures car mufflers wants to determine if there are…
A: Given : Total no. of car mufflers=485 Significance level =5%
Q: Suppose that a market research analyst for a cell phone company conducts a study of their customers…
A: It is given that the mean is 30.
Q: Can smoking negatively affect one's ability to become pregnant? A study collected data on 654 women…
A: Given Total number of women
Q: Question 13: You wish to test the following claim (H1H1) at a significance level of α=0.01α=0.01.…
A: Given,n=7x¯=56.1s=8.8H0:μ=50.8H1:μ>50.8α=0.01degrees of freedom(df)=n-1df=7-1=6
Q: For any value of a, we have: ta/2,00 = Za/2 True O False
A: Solution-: For any value of α we have, tα/2,∞=Zα/2 True or false
Q: The table to the right shows estimates of mobile data traffic, in exabytes (1018 bytes) per month,…
A: Given Number of year 7
Q: A forester with the National Park Service was tasked with estimating the average age of the bald…
A:
Q: Ask the ages of your 10 relatives (patents, siblings, cousins, aunt, uncle and the like). Present…
A: Hi! Thank you for the question, As per the honor code, we are allowed to answer three sub-parts at a…
Q: An advertising agency collected a random sample of 300 businesses targeted with an advertising…
A:
Q: You want to estimate the mean weight of quarters in circulation. A sample of 50 quarters has a mean…
A: Given n=50 X-bar=5.658 S=0.064
Q: Scenario 3: On an examination given to students at a large number of different schools, the mean…
A: Given Information: The mean score in an examination given to students at a large number of different…
Q: 3: Let X₁. X, Exponential (8) (1) Find UMP test of size a for testing H₁ : 0 = 1 against H₁ : 0 > 1.…
A:
Q: estion 24: A regression was run to determine if there is a relationship between hours of TV watched…
A: Given data, The regression equation is y=ax+b y=-1.144x+35.462 If x=9 y=?
Q: Joan's Nursery specializes in custom-designed landscaping for residential areas. The estimated labor…
A: Given data is2.2,2.7,1.4,2.4,2.5,2.4,1.8,3.2,1.6,2.9sample size(n)=10significance level(α)=0.05
Q: stion 10: You are conducting a study to determine if there is a significant difference between…
A: Given data,n1=60x1=160s1=7n2=55x2=155s2=8Calculate the test statistic t ?
Q: (c) What is the probability of obtaining x = 152 or fewer individuals with the characteristic? That…
A: Given Data population proportion,p = 0.8 sample size n = 200
Q: If X Z N(5,4), then what is the probability that 8 < Y < 13 where Y = 2r +1?
A: Solution: Let X~N(μ= 5, σ2= 4)
Q: Use the data in the following table, which lists drive-thru order accuracy at popular fast food…
A:
Q: Question no 4 Let \(X\) be a normally distributed random variablewith a mean 550 and a standard…
A: Given,mean(μ)=550standard deviation(σ)=150and raw score(X)=600
Q: A random sample of 40 items resulted in a sample mean of 25. The population variance is ?2 = 25.a.…
A: GivenMean(μ)=25population variance(σ2)=25standard deviation(σ)=25=5sample size(n)=40
Q: Determine whether the statement below makes sense or does not make sense. Explain clearly. Based on…
A: Confidence interval is a method of estimations.
Q: A headline on a news website stated “Sheep with a varied diet grew faster and produced less…
A: To find: (i) Is the study reported on an experiment or an observational study? Explain your…
Q: Which statement is true about the data shown below (a=0.05) 20 40 60 80 y 24 1.20 1.71 2.22 a. The…
A: The coefficient of determination = r2 or R2
Q: Question 12: Test the claim that the proportion of men who own cats is larger than 50% at the .005…
A:
Q: Use the standard normal distribution to find P(-2.25 < z < 0). 0.6831 0.5122 0.4878 0.0122
A:
Q: Question 25: The weights of newborn children in the United States vary according to the normal…
A: Use the One sample t test Followings are the Explanation of the question The provided sample mean is…
Q: The regression equation to predict the total world gross ticket sales from the opening weekend…
A: Given the regression equation to predict the total world gross ticket sales from the opening weekend…
Q: Carry your intermediate computations to at least three decimal places. Round your answers to one…
A: given data : 2.23,1.76,0.43,0.99,-2.9,-0.35,1.69,-0.1,-0.62,-1.48,-2.53,1.15 from the…
Q: Calculate the test-statistic, t with the following information. n 1 = 60 n 1 = 60 , ¯ x 1 = 2.6 x ¯…
A: Givenn1=60x1=2.6s1=0.7n2=45x2=2.88s2=0.87
Q: An airline knows from experience that the distribution of the number of suitcases that get lost each…
A: GivenMean(μ)=15.5standard deviation(σ)=3.6
Q: (a) Consider a t distribution with 5 degrees of freedom. Compute P (t≥ 1.88). Round your answer to…
A: a) Given data : Degree of freedom, df = 5
Q: Scenario 2: The mean content of 25 bottles of brand S mango juice is 255 ml with a standard…
A: Given data: Sample size = 25 Sample mean = 255 mL Sample standard deviation = 9 mL Population mean =…
Q: A study was conducted that investigated the gene ACTN3, which encodes a protein that functions in…
A: Solution: We are interested in testing the hypothesis that whether there is an association between…
Q: An article contains 1303 words. The frequencies of words with various lengths are given in the…
A: The question is about probability Given :
Q: (a) The sample has size 10, and it is from a population with a distribution about which we know very…
A: Solution-: The sample has size 10, and it is from a population with a distribution about which we…
Q: 2.09 3.73 2.39 0.67 Determine the appropriate conclusion for this hypothesis test. The sample data…
A: Given data sample size, n =1375 population proportion,p= 0.87 Significance…
Q: You wish to test the following claim (H) at a significance level of a = 0.10. Ho:μ = 90.2 Ha:μ <…
A:

Step by step
Solved in 3 steps with 5 images

- Is it possible that P(AB)=P(A)? Explain.Joaquin gets paid every Friday. FI is paychecks for the past 8 Fridays were $315, $236.25, $236.25, $236.25, $315, $315, $236.25, $393.75. Find the (a) mean, (b) median, and (c) mode.Is the number of games won by a major league baseball team in a season related to the team batting average? The table below shows the number of games won and the batting average (in thousandths) of 8 teams. Team Games Won Batting Average 1 8383 289289 2 116116 290290 3 101101 287287 4 8181 262262 5 110110 288288 6 119119 269269 7 6060 268268 8 6161 280280 Using games won as the explanatory variable xx, do the following: (a) The correlation coefficient is r=r= . (b) The equation of the least squares line is y^=y^=
- Is the number of games won by a major league baseball team in a season related to the team batting average? The table below shows the number of games won and the batting average (in thousandths) of 8 teams. Team Games Won Batting Average 1 9797 269269 2 9595 275275 3 8686 273273 4 9999 261261 5 6464 285285 6 118118 260260 7 8787 274274 8 8888 280280 Using games won as the explanatory variable ?x, compute the correlation coefficientFrom a boxplot, one can determine: a. The mean b. The median c. The interquartile ranged. d. All of the above. e None oftheaboveIs the number of games won by a major league baseball team in a season related to the team batting average? The table below shows the number of games won and the batting average (in thousandths) of 8 teams. Team Games Won Batting Average 1 6060 259259 2 120120 277277 3 8989 263263 4 101101 288288 5 8585 287287 6 109109 270270 7 7777 272272 8 106106 290290 Using games won as the explanatory variable xx, do the following: (a) The correlation coefficient is r=r= . (b) The equation of the least squares line is y^=y^= . Speak
- 63836282637x83628363296/836384638363863+93733946384747/9x9374A researcher wants to determine the sensitivity of mammograms to determine how effective they are at diagnosing women who have breast cancer. Assume the researcher obtained the above results from a study, calculate and interpret the sensitivity of mammograms for detecting breast cancer. Frequency of Breast Cancer Cases Frequency of Non-Cancer Cases Frequency of Individuals Who Screened Positive 17 5 Frequency of Individuals Who Screened Negative 8 77A computer ANOVA output is shown below. Fill in the blanks. You may give bounds on the P-value. One-way ANOVA Source DF SS MS F P Factor ? ? 246.93 ? ? Error 25 186.53 ? Total 29 1174.24
- The racial/ethnic diversity of post high school students enrolled at MVCC during the fall 2020 semester is given below. Racial/Ethnic Diversity of Post High School Students Race/Ethnicity Percent* American Indian or Alaska Native 0.4% Asian 5.3% Black or African American 9.6% Hispanic or Latino 9.6% Two or more races 2.8% Native Hawaiian or Pacific Islander <0.1% Non-Resident Alien 0.5% Unknown 1.5% White 70.2% (*Percentages may not total 100 due to rounding) What is the race/ethnicity of the majority of students at MVCC? What total percent of students were either Black or African American or Hispanic or Latino? There were 3,444 students enrolled at MVCC at the time of the study. How many (not percent) students were Asian? (The answer must be a whole number.)The number of people per movie theatre was calculated for the 94 departments from continental Metropolitan France). The following chart shows the results in tabulated form, where bin is measured in 1000s of people. (For example, there are 3 departments with between 0-10,000 people per theatre.) bin n (0,10] 3 (10,20] 17 (20,30] 35 (30,40] 25 (40,50] 8 (50,60] 5 (60,70] 1 How much flexibility did you have in choosing the bin-width? Explain briefly.A researcher wants to determine the sensitivity of mammograms to determine how effective they are at diagnosing women who have breast cancer. Assume the researcher obtained the above results from a study, calculate and interpret the sensitivity of mammograms for detecting breast cancer. Frequency of Breast Cancer Cases Frequency of Non-Cancer Cases Frequency of Individuals Who Screened Positive 17 5 Frequency of Individuals Who Screened Negative 8 77 A total of 66.67% of individuals who have breast cancer test positive for breast cancer when using a mammogram as the primary diagnostic test for breast cancer. A total of 68% of individuals who have breast cancer test positive for breast cancer when using a mammogram as the primary diagnostic test for breast cancer. A total of 70.59% of individuals who have breast cancer test positive for breast cancer when using a mammogram as the primary diagnostic test for breast cancer. A total of 92.77% of…
