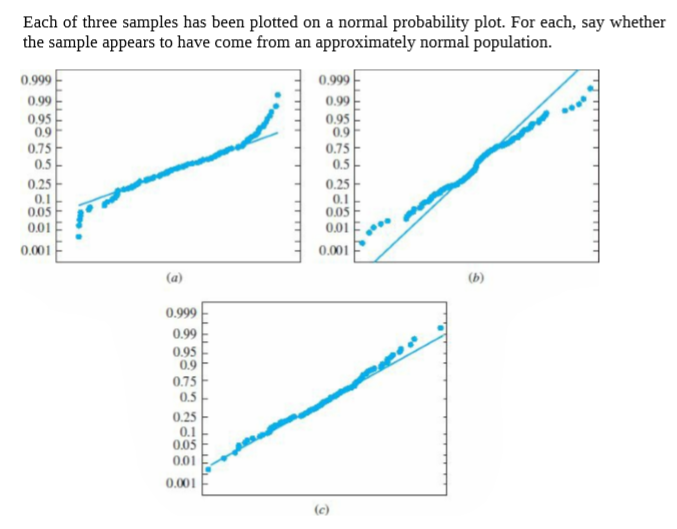
Each of three samples has been plotted on a normal probability plot. For each, say whether the sample appears to have come from an approximately normal population. 0.999 0.999 0.99 0.99 0.95 0.9 0.75 0.5 0.95 0.9 0.75 0.5 0.25 0.1 0.05 0.25 0.1 0.05 0.01 0.01 0.001 0.001 (a) (b) 0.999 0.99 0.95 0.9 0.75 0.5 0.25 0.1 0.05 0.01 0.001 (c)
Each of three samples has been plotted on a normal probability plot. For each, say whether the sample appears to have come from an approximately normal population. 0.999 0.999 0.99 0.99 0.95 0.9 0.75 0.5 0.95 0.9 0.75 0.5 0.25 0.1 0.05 0.25 0.1 0.05 0.01 0.01 0.001 0.001 (a) (b) 0.999 0.99 0.95 0.9 0.75 0.5 0.25 0.1 0.05 0.01 0.001 (c)

Chapter8: Sequences, Series,and Probability
Section8.7: Probability
Problem 11ECP: A manufacturer has determined that a machine averages one faulty unit for every 500 it produces....

Related questions
Question
100%
Transcribed Image Text:Each of three samples has been plotted on a normal probability plot. For each, say whether
the sample appears to have come from an approximately normal population.
0.999
0.999
0.99
0.99
0.95
0.9
0.75
0.5
0.95
0.9
0.75
0.5
0.25
0.1
0.05
0.25
0.1
0.05
0.01
0.01
0.001
0.001
(a)
(b)
0.999
0.99
0.95
0.9
0.75
0.5
0.25
0.1
0.05
0.01
0.001
(c)
Expert Solution
This question has been solved!
Explore an expertly crafted, step-by-step solution for a thorough understanding of key concepts.

This is a popular solution!

Trending now
This is a popular solution!

Step by step
Solved in 3 steps

Recommended textbooks for you

Glencoe Algebra 1, Student Edition, 9780079039897…
Algebra
ISBN:
9780079039897
Author:
Carter
Publisher:
McGraw Hill
Glencoe Algebra 1, Student Edition, 9780079039897…
Algebra
ISBN:
9780079039897
Author:
Carter
Publisher:
McGraw Hill