Each year, more than 2 million people in the United States become infected with bacteria that are resistant to antibiotics. In particular, the Centers of Disease Control and Prevention have launched studies of drug-resistant gonorrhea.t Suppose that, of 174 cases tested in a certain state, 11 were found to be drug-resistant. Suppose also that, of 375 cases tested in another state, 7 were found to be drug-resistant. Do these data suggest a statistically significant difference between the proportions of drug-resistant cases in the two states? Use a 0.02 level of significance. (Let p, = the population proportion of drug-resistant cases in the first state, and let p, = the population proportion of drug resistant cases in the second state.) State the null and alternative hypotheses. (Enter != for # as needed.)
Each year, more than 2 million people in the United States become infected with bacteria that are resistant to antibiotics. In particular, the Centers of Disease Control and Prevention have launched studies of drug-resistant gonorrhea.t Suppose that, of 174 cases tested in a certain state, 11 were found to be drug-resistant. Suppose also that, of 375 cases tested in another state, 7 were found to be drug-resistant. Do these data suggest a statistically significant difference between the proportions of drug-resistant cases in the two states? Use a 0.02 level of significance. (Let p, = the population proportion of drug-resistant cases in the first state, and let p, = the population proportion of drug resistant cases in the second state.) State the null and alternative hypotheses. (Enter != for # as needed.)

Linear Algebra: A Modern Introduction
4th Edition
ISBN:9781285463247
Author:David Poole
Publisher:David Poole
Chapter7: Distance And Approximation
Section7.3: Least Squares Approximation
Problem 31EQ

Related questions

Concept explainers
Contingency Table
A contingency table can be defined as the visual representation of the relationship between two or more categorical variables that can be evaluated and registered. It is a categorical version of the scatterplot, which is used to investigate the linear relationship between two variables. A contingency table is indeed a type of frequency distribution table that displays two variables at the same time.
Binomial Distribution
Binomial is an algebraic expression of the sum or the difference of two terms. Before knowing about binomial distribution, we must know about the binomial theorem.
Topic Video
Question
Transcribed Image Text:You may need
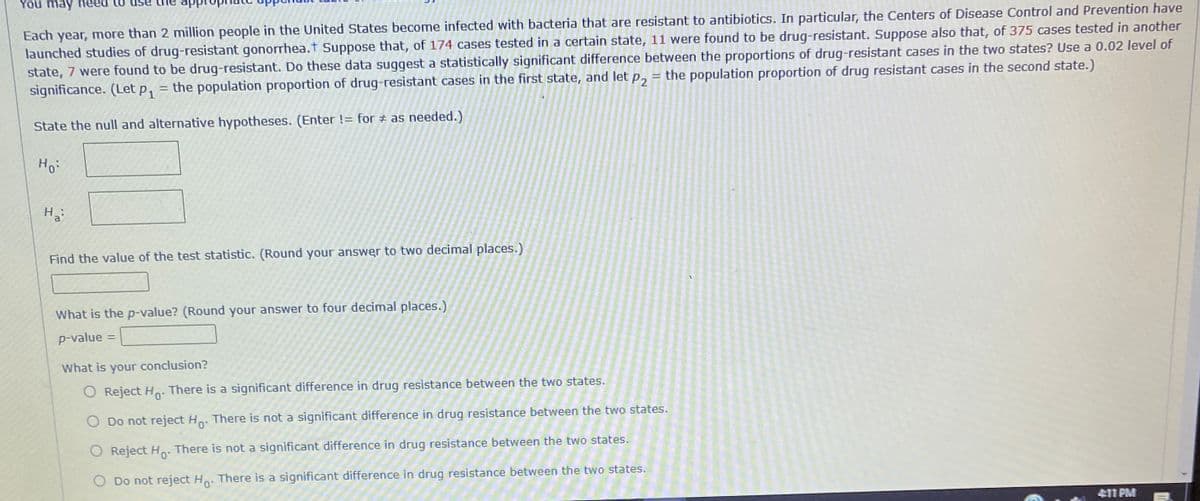
Each year, more than 2 million people in the United States become infected with bacteria that are resistant to antibiotics. In particular, the Centers of Disease Control and Prevention have
launched studies of drug-resistant gonorrhea.t Suppose that, of 174 cases tested in a certain state, 11 were found to be drug-resistant. Suppose also that, of 375 cases tested in another
state, 7 were found to be drug-resistant. Do these data suggest a statistically significant difference between the proportions of drug-resistant cases in the two states? Use a 0.02 level of
significance. (Let p, = the population proportion of drug-resistant cases in the first state, and let p,
the population proportion of drug resistant cases in the second state.)
%3D
State the null and alternative hypotheses. (Enter != for # as needed.)
Ho:
Find the value of the test statistic. (Round your answer to two decimal places.)
What is the p-value? (Round your answer to four decimal places.)
p-value
What is your conclusion?
O Reject H: There is a significant difference in drug resistance between the two states.
O Do not reject H. There is not a significant difference in drug resistance between the two states.
O Reject Ho: There is not a significant difference in drug resistance between the two states.
O Do not reject H. There is a significant difference in drug resistance between the two states.
411 PM
Expert Solution
This question has been solved!
Explore an expertly crafted, step-by-step solution for a thorough understanding of key concepts.

This is a popular solution!

Trending now
This is a popular solution!

Step by step
Solved in 4 steps

Knowledge Booster


Learn more about
Need a deep-dive on the concept behind this application? Look no further. Learn more about this topic, statistics and related others by exploring similar questions and additional content below.Recommended textbooks for you
Linear Algebra: A Modern Introduction
Algebra
ISBN:
9781285463247
Author:
David Poole
Publisher:
Cengage Learning

Glencoe Algebra 1, Student Edition, 9780079039897…
Algebra
ISBN:
9780079039897
Author:
Carter
Publisher:
McGraw Hill

Holt Mcdougal Larson Pre-algebra: Student Edition…
Algebra
ISBN:
9780547587776
Author:
HOLT MCDOUGAL
Publisher:
HOLT MCDOUGAL
Linear Algebra: A Modern Introduction
Algebra
ISBN:
9781285463247
Author:
David Poole
Publisher:
Cengage Learning
Glencoe Algebra 1, Student Edition, 9780079039897…
Algebra
ISBN:
9780079039897
Author:
Carter
Publisher:
McGraw Hill
Holt Mcdougal Larson Pre-algebra: Student Edition…
Algebra
ISBN:
9780547587776
Author:
HOLT MCDOUGAL
Publisher:
HOLT MCDOUGAL

Big Ideas Math A Bridge To Success Algebra 1: Stu…
Algebra
ISBN:
9781680331141
Author:
HOUGHTON MIFFLIN HARCOURT
Publisher:
Houghton Mifflin Harcourt
