Education Not a H.S. graduate H.S. graduate Some college Bachelor Degree or higher The following data represent the level of health and the level of Excellent Good Fair Рoor 140 212 52 135 education for a random sample of 1877 residents. Complete parts (a)- and (b) below. 93 202 60 118 106 198 52 127 72 141 58 111 Click the icon to view the Chi-Square table of critical values. ... (a) Does the sample evidence suggest that level of education and health are independent at the a = 0.05 level of significance? Conduct a P-value hypothesis test. State the hypotheses. Choose the correct answer below. A. Ho: H1 = E, and H2 = E2 and 3 = E3 and H4 = E4 %3D H: At least one mean is different from what is expected. B. Ho: P1 = P2 = P3 H1: At least one of the proportions are not equal. C. Ho: Level of education and health are independent. H: Level of education and health are dependent. Calculate the test statistic. (Round to three decimal places as needed.) %3D
Education Not a H.S. graduate H.S. graduate Some college Bachelor Degree or higher The following data represent the level of health and the level of Excellent Good Fair Рoor 140 212 52 135 education for a random sample of 1877 residents. Complete parts (a)- and (b) below. 93 202 60 118 106 198 52 127 72 141 58 111 Click the icon to view the Chi-Square table of critical values. ... (a) Does the sample evidence suggest that level of education and health are independent at the a = 0.05 level of significance? Conduct a P-value hypothesis test. State the hypotheses. Choose the correct answer below. A. Ho: H1 = E, and H2 = E2 and 3 = E3 and H4 = E4 %3D H: At least one mean is different from what is expected. B. Ho: P1 = P2 = P3 H1: At least one of the proportions are not equal. C. Ho: Level of education and health are independent. H: Level of education and health are dependent. Calculate the test statistic. (Round to three decimal places as needed.) %3D

Glencoe Algebra 1, Student Edition, 9780079039897, 0079039898, 2018
18th Edition
ISBN:9780079039897
Author:Carter
Publisher:Carter
Chapter10: Statistics
Section10.4: Distributions Of Data
Problem 19PFA

Related questions
Question
100%
HW11Q10
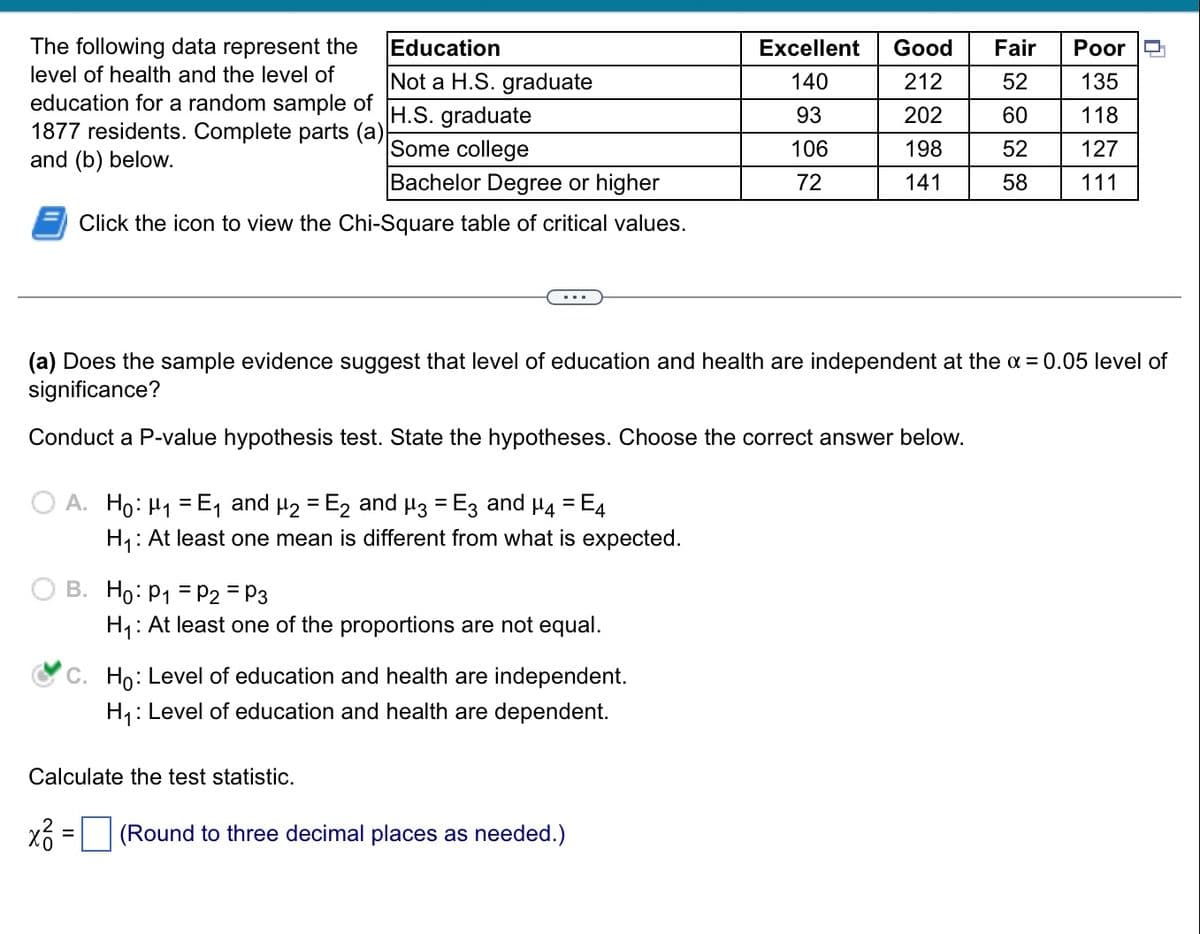
Transcribed Image Text:The following data represent the
Education
Excellent
Good
Fair
Рoor
level of health and the level of
Not a H.S. graduate
H.S. graduate
Some college
Bachelor Degree or higher
140
212
52
135
education for a random sample of
1877 residents. Complete parts (a)
and (b) below.
93
202
60
118
106
198
52
127
72
141
58
111
Click the icon to view the Chi-Square table of critical values.
(a) Does the sample evidence suggest that level of education and health are independent at the a = 0.05 level of
significance?
Conduct a P-value hypothesis test. State the hypotheses. Choose the correct answer below.
A. Ho: H1 = E, and µ2 = E2 and H3 = E3 and H4 = E4
H,: At least one mean is different from what is expected.
%3D
%3D
B. Ho: P1 = P2 = P3
H1: At least one of the proportions are not equal.
Oc. Ho: Level of education and health are independent.
H1: Level of education and health are dependent.
Calculate the test statistic.
(Round to three decimal places as needed.)
Expert Solution
This question has been solved!
Explore an expertly crafted, step-by-step solution for a thorough understanding of key concepts.

This is a popular solution!

Trending now
This is a popular solution!

Step by step
Solved in 2 steps with 4 images

Recommended textbooks for you
Glencoe Algebra 1, Student Edition, 9780079039897…
Algebra
ISBN:
9780079039897
Author:
Carter
Publisher:
McGraw Hill
Glencoe Algebra 1, Student Edition, 9780079039897…
Algebra
ISBN:
9780079039897
Author:
Carter
Publisher:
McGraw Hill