the teacher scream and run from one side of the class to the other. The pulse rates (beats per min ute) are shown in a.) Test the hypothesis that the mean student pulse rate is higher after a fright using a= 0.05. 1.) In a statistics class, students took their pulses before and after being frightened. The frightening event was having the table below. Before 68 68 64 100 68 60 After 80 60 92 80 68 84 80 80 68 76 72 112 84 68 88 80 92 104 92 72 I. State your hypotheses 1. State the allowable type I error rate (a.) Calculate your test statistic, the p-value and draw the physical representation of the p-value Make your decision to either reject the null or fail to reject the null. Make a concluding statement. b.) Run a 95% confidence interval for the hypothesis test above. Don't forget to make a proper conclusion.
the teacher scream and run from one side of the class to the other. The pulse rates (beats per min ute) are shown in a.) Test the hypothesis that the mean student pulse rate is higher after a fright using a= 0.05. 1.) In a statistics class, students took their pulses before and after being frightened. The frightening event was having the table below. Before 68 68 64 100 68 60 After 80 60 92 80 68 84 80 80 68 76 72 112 84 68 88 80 92 104 92 72 I. State your hypotheses 1. State the allowable type I error rate (a.) Calculate your test statistic, the p-value and draw the physical representation of the p-value Make your decision to either reject the null or fail to reject the null. Make a concluding statement. b.) Run a 95% confidence interval for the hypothesis test above. Don't forget to make a proper conclusion.

Holt Mcdougal Larson Pre-algebra: Student Edition 2012
1st Edition
ISBN:9780547587776
Author:HOLT MCDOUGAL
Publisher:HOLT MCDOUGAL
Chapter11: Data Analysis And Probability
Section: Chapter Questions
Problem 8CR

Related questions
Question
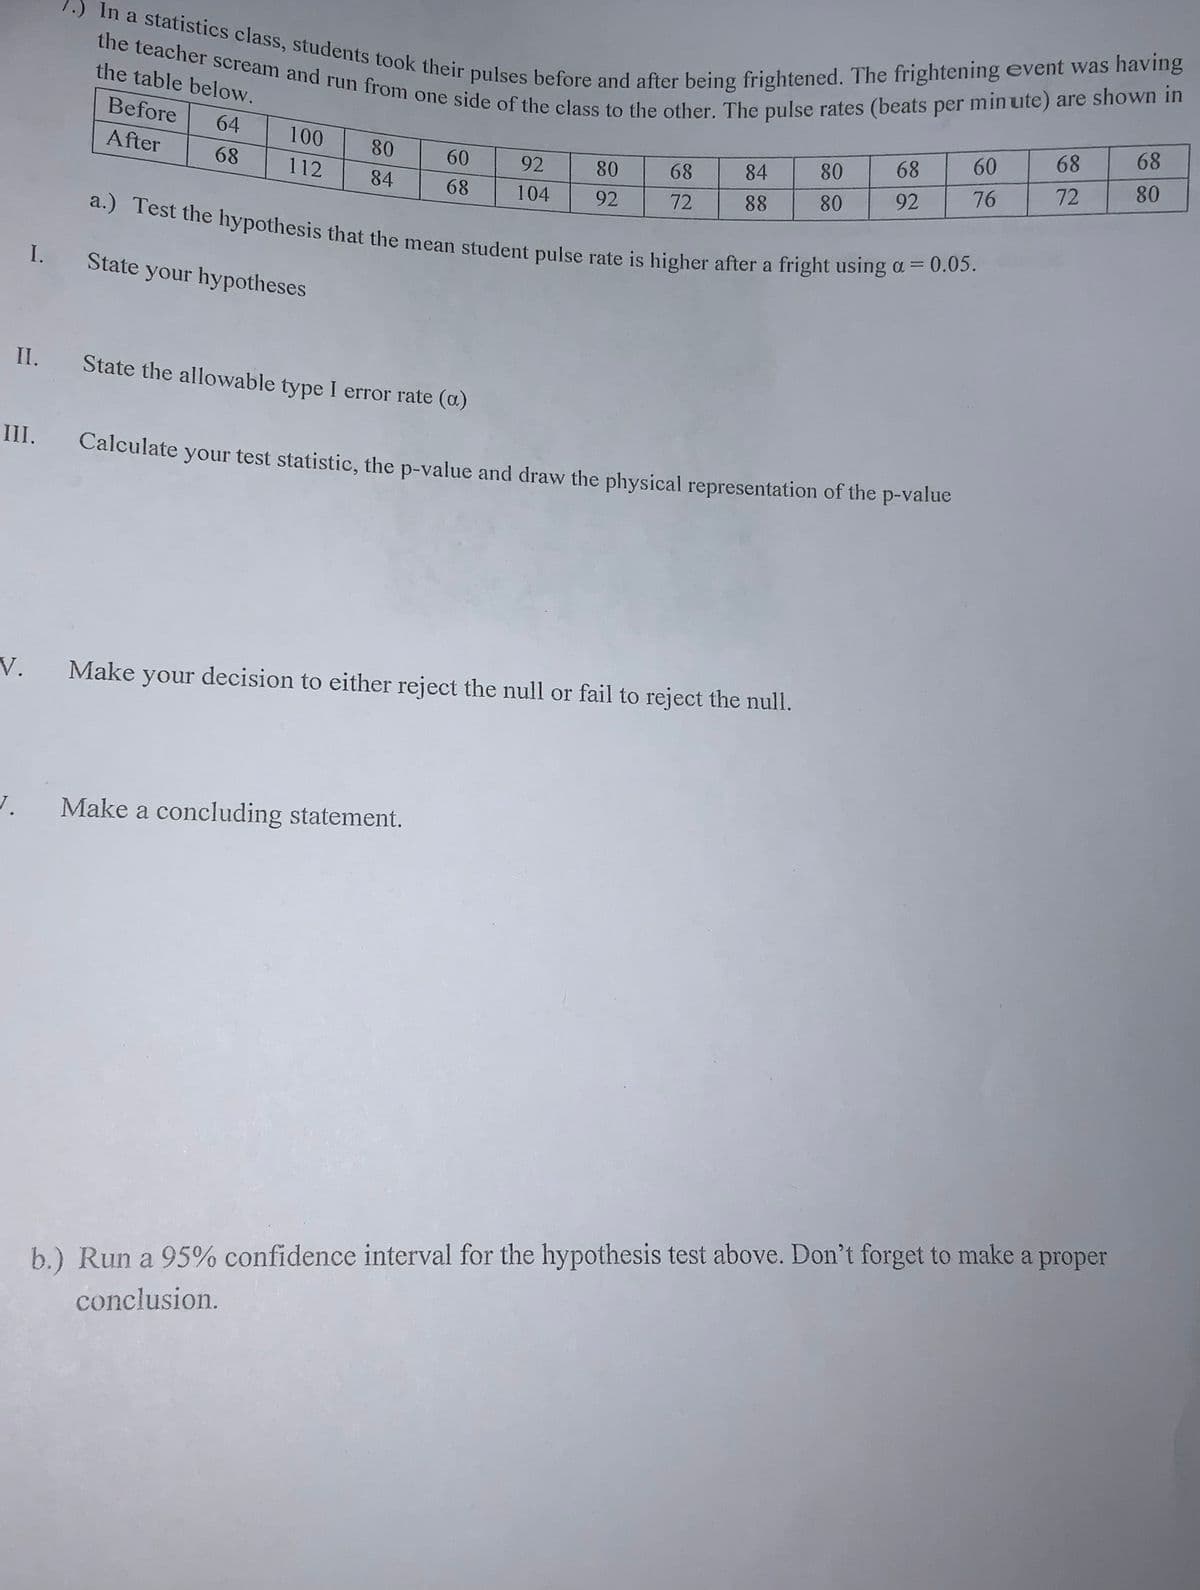
Transcribed Image Text:1.) In a statistics class, students took their pulses before and after being frightened. The frightening event was having
the teacher scream and run from one side of the class to the other. The pulse rates (beats per minute) are shown in
a.) Test the hypothesis that the mean student pulse rate is higher after a fright using a = 0.05.
64
68
68
100
68
60
After
80
60
92
80
68
84
80
80
68
112
76
72
84
68
104
92
72
88
80
92
I.
State your hypotheses
II.
State the allowable type I error rate (a)
III.
Calculate your test statistic, the p-value and draw the physical representation of the p-value
V.
Make your decision to either reject the null or fail to reject the null.
Make a concluding statement.
b.) Run a 95% confidence interval for the hypothesis test above. Don't forget to make a proper
conclusion.
Expert Solution
This question has been solved!
Explore an expertly crafted, step-by-step solution for a thorough understanding of key concepts.

This is a popular solution!

Trending now
This is a popular solution!

Step by step
Solved in 7 steps with 7 images

Recommended textbooks for you
Holt Mcdougal Larson Pre-algebra: Student Edition…
Algebra
ISBN:
9780547587776
Author:
HOLT MCDOUGAL
Publisher:
HOLT MCDOUGAL
Holt Mcdougal Larson Pre-algebra: Student Edition…
Algebra
ISBN:
9780547587776
Author:
HOLT MCDOUGAL
Publisher:
HOLT MCDOUGAL