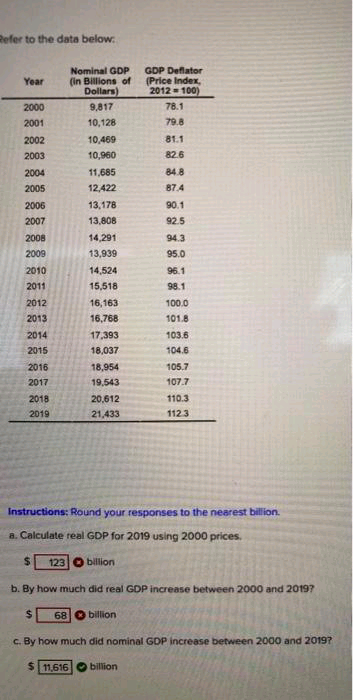
efer to the data below: Nominal GDP (in Billions of Dollars) GDP Deflator (Price Index, 2012- 100) Year 2000 9,817 78.1 2001 10,128 79.8 2002 10,469 81.1 2003 10,960 82.6 2004 11,685 84.8 2005 12,422 87.4 2006 13,178 90.1 2007 13,808 92.5 2008 14,291 94.3 2009 13,939 95.0 2010 14,524 96.1 2011 15,518 98.1 2012 16,163 100.0 2013 16,768 101.8 2014 17,393 103.6 2015 18,037 104.6 2016 18,954 105.7 2017 19,543 107.7 2018 20,612 110.3 2019 21,433 112.3 Instructions: Round your responses to the nearest billion. a. Calculate real GDP for 2019 using 2000 prices. 123 billion b. By how much did real GDP increase between 2000 and 20197 68 O billion C. By how much did nominal GDP increase between 2000 and 20197 $ 11,616 O billion
efer to the data below: Nominal GDP (in Billions of Dollars) GDP Deflator (Price Index, 2012- 100) Year 2000 9,817 78.1 2001 10,128 79.8 2002 10,469 81.1 2003 10,960 82.6 2004 11,685 84.8 2005 12,422 87.4 2006 13,178 90.1 2007 13,808 92.5 2008 14,291 94.3 2009 13,939 95.0 2010 14,524 96.1 2011 15,518 98.1 2012 16,163 100.0 2013 16,768 101.8 2014 17,393 103.6 2015 18,037 104.6 2016 18,954 105.7 2017 19,543 107.7 2018 20,612 110.3 2019 21,433 112.3 Instructions: Round your responses to the nearest billion. a. Calculate real GDP for 2019 using 2000 prices. 123 billion b. By how much did real GDP increase between 2000 and 20197 68 O billion C. By how much did nominal GDP increase between 2000 and 20197 $ 11,616 O billion

Macroeconomics: Principles and Policy (MindTap Course List)
13th Edition
ISBN:9781305280601
Author:William J. Baumol, Alan S. Blinder
Publisher:William J. Baumol, Alan S. Blinder
Chapter6: How Statisticians Measure Inflation
Section6.A: How Statisticians Measure Inflation
Problem 2TY

Related questions
Question
4.
Transcribed Image Text:Refer to the data below:
Nominal GDP
(in Billions of
Dollars)
GDP Deflator
(Price Index,
2012 =100)
Year
2000
9,817
78.1
2001
10,128
79.8
2002
10,469
81.1
2003
10,960
82.6
2004
11,685
84.8
2005
12,422
87.4
2006
13,178
90.1
2007
13,808
92.5
2008
14,291
94.3
2009
13,939
95.0
2010
14,524
96.1
2011
15,518
98.1
2012
16,163
100.0
2013
16,768
101.8
2014
17,393
103.6
2015
18,037
104.6
2016
18,954
105.7
2017
19,543
107.7
2018
20,612
110.3
2019
21,433
1123
Instructions: Round your responses to the nearest billion.
a. Calculate real GDP for 2019 using 2000 prices.
%24
123 O billion
b. By how much did real GDP increase between 2000 and 20197
68
billion
c. By how much did nominal GDP increase between 2000 and 2019?
211,616
billion
Expert Solution
This question has been solved!
Explore an expertly crafted, step-by-step solution for a thorough understanding of key concepts.

This is a popular solution!

Trending now
This is a popular solution!

Step by step
Solved in 2 steps

Recommended textbooks for you
Macroeconomics: Principles and Policy (MindTap Co…
Economics
ISBN:
9781305280601
Author:
William J. Baumol, Alan S. Blinder
Publisher:
Cengage Learning


Macroeconomics: Principles and Policy (MindTap Co…
Economics
ISBN:
9781305280601
Author:
William J. Baumol, Alan S. Blinder
Publisher:
Cengage Learning


Economics: Private and Public Choice (MindTap Cou…
Economics
ISBN:
9781305506725
Author:
James D. Gwartney, Richard L. Stroup, Russell S. Sobel, David A. Macpherson
Publisher:
Cengage Learning

Macroeconomics: Private and Public Choice (MindTa…
Economics
ISBN:
9781305506756
Author:
James D. Gwartney, Richard L. Stroup, Russell S. Sobel, David A. Macpherson
Publisher:
Cengage Learning