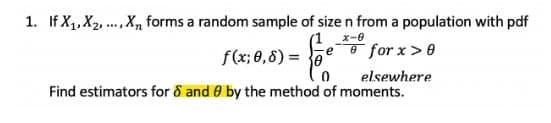
1. If X,, X2, .X, forms a random sample of size n from a population with pdf f(x; 8,8) = 0 for x>0 elsewhere Find estimators for & and 0 by the method of moments.


Q: 9. Which of the following pair of null and alternative hypotheses is correctly stated? А. Н, : и 3…
A:
Q: Find the sample proportion planning to vote for Candidate Y. (Round your answer to two decimal…
A: Given that : Sample size (n) = 400 X = 200 Proportion = x / n By using proportion test we solve…
Q: The city council of Pine Bluffs is considering Increasing the number of police In an effort to…
A: Regression is one type of statistical procedure to study relationship between one dependent and one…
Q: Calculate the standard deviation products sold per store using this sample data 0, 77, 38, -5, 44,…
A: We have given that the sample data 0, 77, 38, -5, 44, 62.
Q: Find the area of the shaded region under the standard normal distribution to the left of the given…
A: In question, Given that z = -0.6 Then we'll find the P(z<-0.6). The solution is below,
Q: 2. The table shows the frequency distribution of 60 employees and their daily wages. First find the…
A: Class size=upper limit- lower limit
Q: it is unbaised estimated of a Then Show That ta is baised estimated of 02. Theorem:- if
A:
Q: Here is a set of sample data 12 27 35 36 52 60 71 73 79 91 95 97 99 100 Identify the 5 number…
A: In a descriptive statistics, the five number summary are given by Minimum First Quartile (Q1)…
Q: An analysis is performed on vacant land parcels in the city of Thunder Bay to find out whether or…
A: “Since you have asked multiple question, we will solve the first question for you. If you want any…
Q: Here is a bivariate data set. x y 20.9 34.2 31.4 144.9 44.3 84.7 55.4 79.8 58.9 50.8 68.7…
A: Given a bivariate data set. x y 20.9 34.2 31.4 144.9 44.3 84.7 55.4 79.8 58.9 50.8…
Q: Calculating the standard error of the difference. given n1=22, n2=28, s1=9.58, and s2=11.13,…
A: Given that n1=22 , n2=28 , s1=9.58 , s2=11.13
Q: The number of reviews for each of the local restaurants is counted. The results are normally…
A:
Q: A sample of n = 10 scores has M = 58, s = 12.65, and an estimated standard error of 4 points. Which…
A: The sample size n is 10, the standard deviation is 12.65 and the standard error is 4.
Q: Find the 94th percentile, P94, from the following data 3 10 12 14 16 17 29 30 31 33 36 39 45 48 51…
A: Solution
Q: Suppose a new treatment for a certain disease is given to a sample of 210 patients. The treatment…
A:
Q: According to the Malaysian Diabetes Association, 25% of Malaysians aged 60 years or older had…
A: Hello! As you have posted more than 3 sub parts, we are answering the first 3 sub-parts. In case…
Q: You create a contingency table but you find that more than 20% of the cells have expected values of…
A: Given that we create a contingency table but we find that more than 20% of the cells have expected…
Q: Below is the observed cell frequencies (fij) in the K × 2 table: # Successes # Failures Total Sample…
A: Solution: From the given information, the observed cell frequencies are
Q: A local dry cleaner interviewed 10 candidates for the position of cashier, washer, salesperson and…
A: Here we will use the concept of permutation formula : nPr = n!/(n - r)
Q: BMX racing is a sprint sport where races range from around 30 to 45 seconds depending on the length…
A: Hey there! Thank you for posting the question. Since your question has more than 3 parts, we are…
Q: A company institutes an exercise break for workers to see if it will improve job satisfaction.…
A: here use basic of hypothesis test selection
Q: he following grou Maths test.
A: Hi! Thank you for the question, As per the honor code, we are allowed to answer three sub-parts at a…
Q: Studies suggest that women who smoke during pregnancy affect the birth weights of their newborn…
A: (c ) Use EXCEL to determine the regression equation. EXCEL procedure: Go to EXCEL Go to…
Q: Which of the following is an example of qualitative data? Select all that apply The sky is blue. The…
A: Example of qualitative data select all that apply?
Q: 1. The table below shows average temperatures recorded over a five-day period last winter (a)…
A:
Q: Derive a model which can be used to predict the maximum fee that they would be willing to pay for…
A: Given: Sr. No. Age Time per month Maximum fee 1 18 2 10 2 19 0 5 3 21 1 10 4 21 1 5 5…
Q: According to a Harvard Health Publishing article, the normal body temperature may be lower than…
A:
Q: 80.2
A:
Q: Find the following probabilities for test scores X, for which the mean is 400 and the standard…
A: Note:(1). According to Bartleby expert guidelines, we can answer only first question with their…
Q: Suppose that in a large population of students, the mean amount of sleep the previous night was u =…
A: Note: According to Bartleby expert guidelines, we can answer only first question with their three…
Q: Use the following ANOVA table for regression to answer the questions. Analysis of Variance Source…
A: From the provided information, The anova table is as follow: Source DF SS MS F P…
Q: Example: The National Health Interview Survey for 2011-2014 estimates that 37% of 18-24 year olds…
A: Solution-: Given: n=30,p=0.37,p^=0.45,α=0.05 We find 95% C.I. for the true population proportion and…
Q: Show that if Z is a standard normal variable and X = Z² then X and Z are uncorrelated, but not…
A:
Q: Find the following probabilities for X = pulse rates of group of people, for which the mean is 74…
A: Let X be the random variable from Normal distribution with mean (µ) = 74, standard deviation (σ) = 8
Q: 14. The regression equation and the standard error of estimate Stewart Fleishman specializes in the…
A: Disclaimer: " Since, you have asked a question with more than three sub parts, but we can only…
Q: What is the lower outlier if Q1 is 54 and Q3 is 160?
A: Given that, first quartile, Q1 = 54 Third quartile, Q3 = 160 We need to find the lower outlier.
Q: A telephone company claims that the mean duration of a long-distance phone calls made by its…
A: Given that Hypothesized Population Mean (\mu)(μ) = 1010 Population Standard Deviation…
Q: Suppose that 65% of people who enter a store will make a purchase. Random samples of people who walk…
A:
Q: Jensen, Solberg, and Zorn investigated the relationship of insider ownership, debt, and dividend…
A: The independent variables are Debt Ratio and Dividend Payout. The dependent variable is Insider…
Q: Using the following data with x as the independent variable and y as the dependent variable, answer…
A: Hi! Thank you for the question, as per the honor code, we are allowed to answer three sub-parts at a…
Q: exit poll of 2293 voters in the 2006 Ohio Senatorial election indicated that 44% voted for the…
A:
Q: What is a sampling distribution of a sample means? Describe the general shape of a sampling…
A: Sampling distribution helps us to understand that how many times or the numbers of times event will…
Q: 3) An oceanographer believes the median wave height off of South Florida's coast is equal to 1.9…
A:
Q: e are two sources of uncertainty: (i) der. Fill in the following table to illu the following table,…
A: A currency forward is a binding contract and the parties involved have to fulfill their part of the…
Q: a. To compute the confidence interval use a ? v distribution. b. With 90% confidence the population…
A:
Q: distribution tab
A: frequency distribution table Class boundaries : subtracting 0.5 from lower class limit and adding…
Q: The claim is a mean is 222 and you want to prove it is less. Test the hypothesis within a 10% level…
A: Given information Mean ( mu ) = 222 Sample mean (xbar) = 213.12 Standard deviation (s) =79.92…
Q: The random variable “body temperature” is an example of: ( a) Interval-scaled data b)…
A: Solution: In the given example we are olny interested in the interval scale of data. Interval scale…
Q: (d) Use the combined data of 80 students, construct a 95% confidence interval estimate of the…
A: Given that Total students=n=40+40=80 Number of pass students=X=28+32=60
Q: Express the confidence interval (346.3, 655.9) in the form of ± ME.
A: here given , confidence Interval (346.3 , 655.9 ) upper limit = 655.9 lower limit = 346.3

Step by step
Solved in 3 steps with 3 images

- If X1, X2, ... , Xn constitute a random sample of size n from an exponential population, show that X is a consis-tent estimator of the parameter θ.If X1, X2, and X3 constitute a random sample of sizen = 3 from a Bernoulli population, show that Y =X1 + 2X2 + X3 is not a sufficient estimator of θ. (Hint:Consider special values of X1, X2, and X3.)If X1, X2, ... , Xn constitute a random sample from anormal population with μ = 0, show that ni=1X2inis an unbiased estimator of σ2.
- Suppose that three random variables X1, X2, X3 form a random sample from the uniform distribution on interval [0, 1]. Determine the value of E[(X1-2X2+X3)2]If X1, X2, ... , Xn constitute a random sample of size nfrom a geometric population, show that Y = X1 + X2 +···+ Xn is a sufficient estimator of the parameter θ.Consider a random sample X1,...,Xn,... ∼ iid Beta(θ,1) for n > 2. Prove that the MLE and UMVUE are both consistent estimators for θ
- Suppose the random variable y is a function of several independent random variables, say x1,x2,...,xn. On first order approximation, which of the following is TRUE in general?Suppose that the random variables X1,...,Xn form a random sample of size n from the uniform distribution on the interval [0, 1]. Let Y1 = min{X1,. . .,Xn}, and let Yn = max{X1,...,Xn}. Find E(Y1) and E(Yn).Let the following simple random sample following:1. Binomial pmf. (11, ¾);2. Uniform pmf;3. Uniform pdf (0, a);4. Exponential pdf with (µ) .Find the corresponding pmf/pdf of Y1 , Y4 , Y7 and F(Yi) where
- If X is a continuous random variable with X ∼ Uniform([0, 2]), what is E[X^3]?In a clinical study, a random sample of 540 participants agree to have their blood drawn, which is to be examined for the presence of antibodies against a certain contagious disease. It is found in 22% of the blood samples, which experimenters hope to extrapolate to the general population. From this random sample, 10 participants' blood samples are selected at random. If X is the number of samples out of the 10 who have these antibodies, what can we say about X? A. The sample size is not large enough for us to approximate X using a normal distribution B.The expected value of X is 22 C. X can be approximated using a normal distribution in lieu of a binomial distribution D. X has a sampling distribution that is normalThere are two traffic lights on a commuter's route to and from work. Let X1 be the number of lights at which the commuter must stop on his way to work, and X2 be the number of lights at which he must stop when returning from work. Suppose that these two variables are independent, each with the pmf given in the accompanying table (so X1, X2 is a random sample of size n = 2). x1 0 1 2 p(x1) 0.1 0.2 0.7 ? = 1.6, ?2 = 0.44 (a) Determine the pmf of To = X1 + X2. to 0 1 2 3 4 p(to) (b) Calculate ?To. ?To = How does it relate to ?, the population mean? ?To = · ? (c) Calculate ?To2. ?To2 = How does it relate to ?2, the population variance? ?To2 = · ?2