Below is the observed cell frequencies (fij) in the K × 2 table: # Successes # Failures Total Sample 1 Y1 ni – Y1 ni Sample 2 Y2 n2 – Y2 n2 - Sample K YK пк - Үк | Under Ho : Pi = P2 =..PK = Po, it is expected to see the following cell frequencies (eij): # Successes # Failures Total Sample 1 nipo п (1 — ро) Sample 2 n2Po n2(1 – po) n2 Sample K NKPO пк (1 — Ро) NK к 2 K Show that lij- eij)² Cij (Y; – n;po)² Σ паро (1 — ро) i=1 j=1 i=1
Below is the observed cell frequencies (fij) in the K × 2 table: # Successes # Failures Total Sample 1 Y1 ni – Y1 ni Sample 2 Y2 n2 – Y2 n2 - Sample K YK пк - Үк | Under Ho : Pi = P2 =..PK = Po, it is expected to see the following cell frequencies (eij): # Successes # Failures Total Sample 1 nipo п (1 — ро) Sample 2 n2Po n2(1 – po) n2 Sample K NKPO пк (1 — Ро) NK к 2 K Show that lij- eij)² Cij (Y; – n;po)² Σ паро (1 — ро) i=1 j=1 i=1

MATLAB: An Introduction with Applications
6th Edition
ISBN:9781119256830
Author:Amos Gilat
Publisher:Amos Gilat
Chapter1: Starting With Matlab
Section: Chapter Questions
Problem 1P

Related questions
Question
part a only please
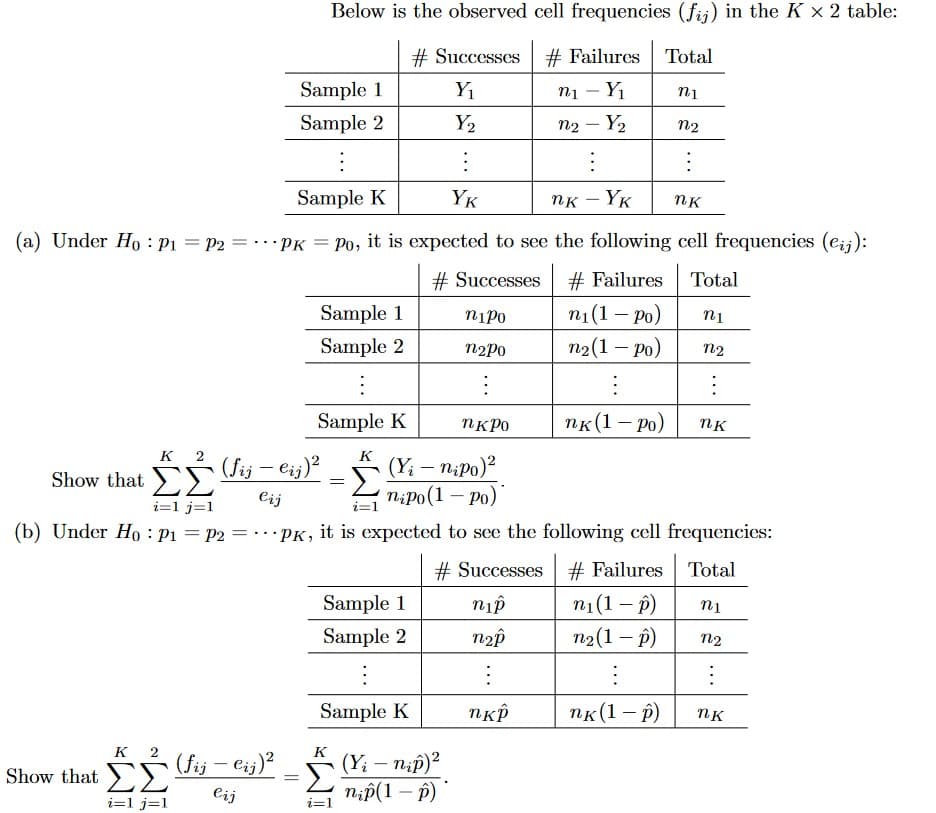
Transcribed Image Text:Below is the observed cell frequencies (fij) in the K x 2 table:
# Successes # Failures
Total
Sample 1
Y1
ni – Y
n1
Sample 2
Y2
n2 – Y2
n2
Sample K
YK
NK – YK
(a) Under Ho : P1 = P2 = ..PK = Po, it is expected to see the following cell frequencies (eij):
# Successes
# Failures
Total
пi (1 — ро)
п2(1 — Ро)
Sample 1
nipo
n1
Sample 2
n2Po
n2
Sample K
nK Po
пк (1 — ро)
к 2
Show that (Sij – eij)²
Cij
K
(fij – eij)?
(Y; – nipo)?
Σ
паро(1 — Ро)
|
i=1 j=1
(b) Under Ho : P1 = P2 = ..·pK, it is expected to see the following cell frequencies:
%3D
# Successes # Failures Total
Sample 1
nip
п (1 — р)
Sample 2
n2(1 – p)
n2
Sample K
пк(1 —р)
к 2
K
n;f)?
– nip)²
(Yi -
n;p(1 – p)
Show that E
(fij – Cij)²
-
Eij
i=1 j=1
i=1
Expert Solution
This question has been solved!
Explore an expertly crafted, step-by-step solution for a thorough understanding of key concepts.

This is a popular solution!

Trending now
This is a popular solution!

Step by step
Solved in 2 steps with 6 images

Recommended textbooks for you
MATLAB: An Introduction with Applications
Statistics
ISBN:
9781119256830
Author:
Amos Gilat
Publisher:
John Wiley & Sons Inc

Probability and Statistics for Engineering and th…
Statistics
ISBN:
9781305251809
Author:
Jay L. Devore
Publisher:
Cengage Learning

Statistics for The Behavioral Sciences (MindTap C…
Statistics
ISBN:
9781305504912
Author:
Frederick J Gravetter, Larry B. Wallnau
Publisher:
Cengage Learning
MATLAB: An Introduction with Applications
Statistics
ISBN:
9781119256830
Author:
Amos Gilat
Publisher:
John Wiley & Sons Inc
Probability and Statistics for Engineering and th…
Statistics
ISBN:
9781305251809
Author:
Jay L. Devore
Publisher:
Cengage Learning
Statistics for The Behavioral Sciences (MindTap C…
Statistics
ISBN:
9781305504912
Author:
Frederick J Gravetter, Larry B. Wallnau
Publisher:
Cengage Learning

Elementary Statistics: Picturing the World (7th E…
Statistics
ISBN:
9780134683416
Author:
Ron Larson, Betsy Farber
Publisher:
PEARSON

The Basic Practice of Statistics
Statistics
ISBN:
9781319042578
Author:
David S. Moore, William I. Notz, Michael A. Fligner
Publisher:
W. H. Freeman

Introduction to the Practice of Statistics
Statistics
ISBN:
9781319013387
Author:
David S. Moore, George P. McCabe, Bruce A. Craig
Publisher:
W. H. Freeman