Empirical Rule and Tchebychev Inequality Assume a distribution has mean u = 84 and standard deviation g = 10: In a) through c) we assume the distribution is mound-shaped (approximately normally distributed) so that the empirical rule applies. a) What percentage of the data points are within the range (74, 94)? What percentage is within the range (64, 104)? b) What the percentage of the data points that are less than 74? What percentage is less than 64? c) What percentage of the data points are within the range (74, 84)? What percentage is within the range (94, 104)? In part d) we assume nothing is know about the distribution so that it is potentially very irregularly shaped. How much of the data can the be guaranteed to be within the range (64, 104)?
Empirical Rule and Tchebychev Inequality Assume a distribution has mean u = 84 and standard deviation g = 10: In a) through c) we assume the distribution is mound-shaped (approximately normally distributed) so that the empirical rule applies. a) What percentage of the data points are within the range (74, 94)? What percentage is within the range (64, 104)? b) What the percentage of the data points that are less than 74? What percentage is less than 64? c) What percentage of the data points are within the range (74, 84)? What percentage is within the range (94, 104)? In part d) we assume nothing is know about the distribution so that it is potentially very irregularly shaped. How much of the data can the be guaranteed to be within the range (64, 104)?

MATLAB: An Introduction with Applications
6th Edition
ISBN:9781119256830
Author:Amos Gilat
Publisher:Amos Gilat
Chapter1: Starting With Matlab
Section: Chapter Questions
Problem 1P

Related questions
Topic Video
Question
100%
Can someone help me with these.
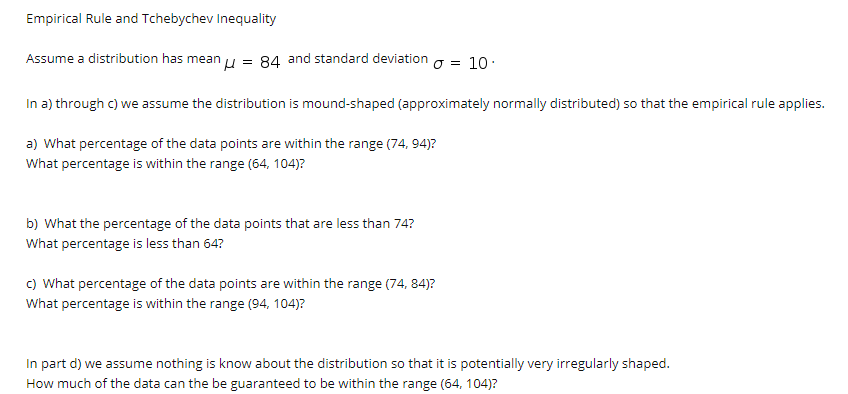
Transcribed Image Text:Empirical Rule and Tchebychev Inequality
Assume a distribution has mean u = 84 and standard deviation g = 10:
In a) through c) we assume the distribution is mound-shaped (approximately normally distributed) so that the empirical rule applies.
a) What percentage of the data points are within the range (74, 94)?
What percentage is within the range (64, 104)?
b) What the percentage of the data points that are less than 74?
What percentage is less than 64?
c) What percentage of the data points are within the range (74, 84)?
What percentage is within the range (94, 104)?
In part d) we assume nothing is know about the distribution so that it is potentially very irregularly shaped.
How much of the data can the be guaranteed to be within the range (64, 104)?
Expert Solution
This question has been solved!
Explore an expertly crafted, step-by-step solution for a thorough understanding of key concepts.

Step by step
Solved in 2 steps with 2 images

Knowledge Booster


Learn more about
Need a deep-dive on the concept behind this application? Look no further. Learn more about this topic, statistics and related others by exploring similar questions and additional content below.Recommended textbooks for you
MATLAB: An Introduction with Applications
Statistics
ISBN:
9781119256830
Author:
Amos Gilat
Publisher:
John Wiley & Sons Inc

Probability and Statistics for Engineering and th…
Statistics
ISBN:
9781305251809
Author:
Jay L. Devore
Publisher:
Cengage Learning

Statistics for The Behavioral Sciences (MindTap C…
Statistics
ISBN:
9781305504912
Author:
Frederick J Gravetter, Larry B. Wallnau
Publisher:
Cengage Learning
MATLAB: An Introduction with Applications
Statistics
ISBN:
9781119256830
Author:
Amos Gilat
Publisher:
John Wiley & Sons Inc
Probability and Statistics for Engineering and th…
Statistics
ISBN:
9781305251809
Author:
Jay L. Devore
Publisher:
Cengage Learning
Statistics for The Behavioral Sciences (MindTap C…
Statistics
ISBN:
9781305504912
Author:
Frederick J Gravetter, Larry B. Wallnau
Publisher:
Cengage Learning

Elementary Statistics: Picturing the World (7th E…
Statistics
ISBN:
9780134683416
Author:
Ron Larson, Betsy Farber
Publisher:
PEARSON

The Basic Practice of Statistics
Statistics
ISBN:
9781319042578
Author:
David S. Moore, William I. Notz, Michael A. Fligner
Publisher:
W. H. Freeman

Introduction to the Practice of Statistics
Statistics
ISBN:
9781319013387
Author:
David S. Moore, George P. McCabe, Bruce A. Craig
Publisher:
W. H. Freeman