en

Mathematics For Machine Technology
8th Edition
ISBN:9781337798310
Author:Peterson, John.
Publisher:Peterson, John.
Chapter59: Areas Of Rectangles, Parallelograms, And Trapezoids
Section: Chapter Questions
Problem 79A

Related questions

Concept explainers
Contingency Table
A contingency table can be defined as the visual representation of the relationship between two or more categorical variables that can be evaluated and registered. It is a categorical version of the scatterplot, which is used to investigate the linear relationship between two variables. A contingency table is indeed a type of frequency distribution table that displays two variables at the same time.
Binomial Distribution
Binomial is an algebraic expression of the sum or the difference of two terms. Before knowing about binomial distribution, we must know about the binomial theorem.
Topic Video
Question
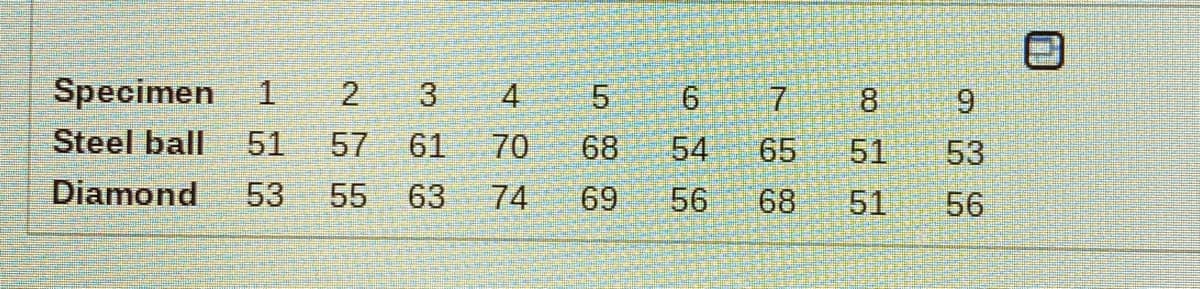
Transcribed Image Text:Specimen 1
4
8.
6.
Steel ball
51
57
61
70
68
54
65
51
53
Diamond
53
55
63
74
69
56
68
51
56
2.
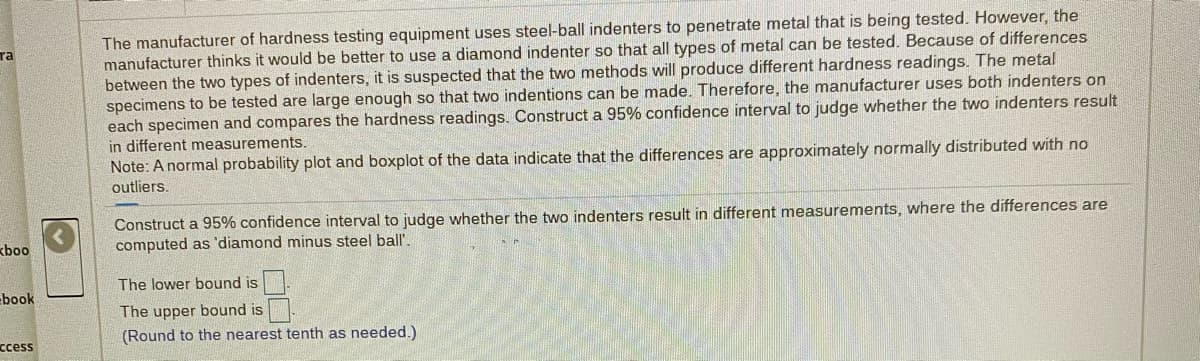
Transcribed Image Text:The manufacturer of hardness testing equipment uses steel-ball indenters to penetrate metal that is being tested. However, the
manufacturer thinks it would be better to use a diamond indenter so that all types of metal can be tested. Because of differences
between the two types of indenters, it is suspected that the two methods will produce different hardness readings. The metal
specimens to be tested are large enough so that two indentions can be made. Therefore, the manufacturer uses both indenters on
each specimen and compares the hardness readings. Construct a 95% confidence interval to judge whether the two indenters result
in different measurements.
ra
Note: A normal probability plot and boxplot of the data indicate that the differences are approximately normally distributed with no
outliers.
Construct a 95% confidence interval to judge whether the two indenters result in different measurements, where the differences are
computed as 'diamond minus steel ball'.
kboo
The lower bound is
book
The upper bound is
(Round to the nearest tenth as needed.)
ccess
Expert Solution
This question has been solved!
Explore an expertly crafted, step-by-step solution for a thorough understanding of key concepts.

Step by step
Solved in 2 steps

Knowledge Booster


Learn more about
Need a deep-dive on the concept behind this application? Look no further. Learn more about this topic, statistics and related others by exploring similar questions and additional content below.Recommended textbooks for you
Mathematics For Machine Technology
Advanced Math
ISBN:
9781337798310
Author:
Peterson, John.
Publisher:
Cengage Learning,
Mathematics For Machine Technology
Advanced Math
ISBN:
9781337798310
Author:
Peterson, John.
Publisher:
Cengage Learning,