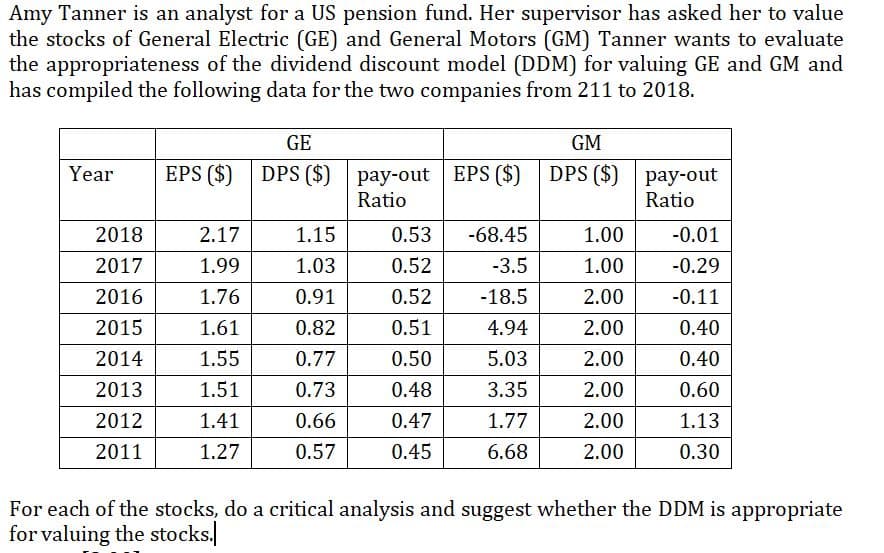
EPS ($) DPS ($) pay-out EPS ($) DPS ($) Ratio Year рay-out Ratio 2018 2.17 1.15 0.53 -68.45 1.00 -0.01 2017 1.99 1.03 0.52 -3.5 1.00 -0.29 2016 1.76 0.91 0.52 -18.5 2.00 -0.11 2015 1.61 0.82 0.51 4.94 2.00 0.40 2014 1.55 0.77 0.50 5.03 2.00 0.40 2013 1.51 0.73 0.48 3.35 2.00 0.60 2012 1.41 0.66 0.47 1.77 2.00 1.13 2011 1.27 0.57 0.45 6.68 2.00 0.30 For each of the stocks, do a critical analysis and suggest whether the DDM is appropriate for valuing the stocks.


Q: 6. Selected financial information for Masks-R-Us Ltd.'s for the last 2 years is available: 2020 2019…
A: Average collection period 365 / Average receivable turnover ratio Average receivable…
Q: 12/31/2018 12/31/2019 Current assets $79,000 $298,000 Current liabilities 49,000 166,000 Using the…
A: Formula: Working capital = Current Assets - current liabilities Deduction of current liabilities…
Q: explain each ratio of this list what happened in 2019, 2020, 2021? List Of Ratio 2019 2020 2021…
A: Ratio analysis is the technique used to analyze the financial health of the company. Different…
Q: Requirement 1. Compute Win's Companies' current ratio at May 31, 2018 and 2017. Begin by selecting…
A: Current Ratio
Q: and 2017 balance shccts is liated below in milions of collars). Ramakrishnan, Inc. reaated 2018 net…
A: The cash flow statement of Ramakrishnan incorporation: Hence, the net cash flow generated from…
Q: 2. Prepare a horizontal analysis for 2022 using 2021 as the base year. (Note: If the percentage…
A: Horizontal analysis is used to compare the financial statement with the previous year. It helps…
Q: PROBLEM E ABC company's total equity for 2019 amounted to P1,750,000. There was a 5% and a 15%…
A: Stockholder's Equity - Stockholder's Equity includes the amount contributed by shareholders issued…
Q: Based on the above information, determine the cash received for interest during 2020.
A: Based on the above information, determine the cash received for interest during 2020. Answer -…
Q: PROBLEM E ABC company's total equity for 2019 amounted to P1,750,000. There was a 5% and a 15%…
A: The equity of the company refers to Stockholder' Equity as of a particular date. It has been given…
Q: Data table ended dec 31,2018 +2017 grs 2018 2017 912,000 otal reenue expenses. osts of goods sold.…
A: Formula: Net income = Revenues - expenses.
Q: 7. The balance sheets of Bonifacio Company include the following: 12/31/2019 12/31/2019 PO Interest…
A: Solution: Total supplies purchased during the period = Supplies expense +Ending supplies -…
Q: Yana Co. collected P15,000 interest during 2020. It showed P2,000 interestreceivable on its December…
A: Accrual system of accounting says that every thing which is accrued has to be provided in books of…
Q: Short-Term Notes Payable 300 Retained Earnings 2377 Sales Revenue 19385 SG&A Expense 2600 2018 Tax…
A: Income statement shows profit earned or loss incurred by a corporation during an accounting year.
Q: Complete (Round your Percentage answer to the nearest hundredths.) 2017 2016 Decrease Amount…
A: Decrease is calculated using the below given formula: Decrease %=Decrease in ValueValue before…
Q: 1. Prepare a vertical analysis of Sports Unlimited's 2021 and 2020 balance sheets. Express each…
A: Comparative balance sheet used to compare the financial statement of two or more periods. It is…
Q: What is the principal invested at 8.75% simple interest on May 21, 2015 that will amount to, ₱34,600…
A: Simple Interest can be calculated using the formula as below: = Principal * Rate * Number of Days /…
Q: Digital eletronic company incomes for the years 2016 through 2020 were OMR(100,000), 300,000,…
A: A company can incur profit or loss in its financial year.
Q: Question for income statement : BAYAN INVESTMENT CO. (K.S.C.P) a. List 2 expense accounts AND their…
A: Net profit is gross profit minus operating expenses and other expenses a like interest expenses…
Q: The income statement of Armenia Corporation for 2020 included the following items: Interest income…
A: Cash basis accounting: In cash basis accounting , revenue are recognized when payment is received…
Q: The income statement of Armenia Corporation for 2020 included the following items: Interest income…
A: Expenses- An expense is the cost of operations incurred by a corporation in order to generate…
Q: BIDDLE COMPANY INCOME STATEMENT FOR YEAR END DECEMBER 31, 2018 SALES REVENUE $142,000.00 EXPENSES:…
A: The cash flow statement is prepared to record the cash transactions incurred during the period and…
Q: Lan & Chen Technologies: Income Statements for Year Ending December 31…
A: Hey, since there are multiple sub-part questions posted, we will answer the first three questions.…
Q: the caprent sectioves of Saasola CorpS hallance sheels alt December 31, 2016 and 2017, are presevted…
A: Cash flow from operating activities is a section in Cash Flow Statememt which shows all cash inflows…
Q: Calculate EBITDA/interest, Debt/EBITDA and fixed charge coverage for each of the 3 years.
A: Information provided: 2013 2014 2015 Revenue…
Q: (a) Calculate the current ratio and working capital for 3M for 2021 and 2022. (Round current ratio…
A: 1. Current ratio = Current assets / Current liabilities 2. Working capital = Current assets -…
Q: Current Ratio = Current Assets/Current Liabilities 2020 2019 13,896,794,073/13,864,318,289 = 1.00:1…
A: Current Ratio is the ratio which shows the short term liquidity position of the company that how…
Q: Lan & Chen Technologies: Income Statements for Year Ending December 31…
A: Ratio Analysis: Ratio analysis helps in getting an idea about an entity's operational efficiency,…
Q: MVP Company has below ratios for the year 2021: ROA = 10% Current Ratio = 2:1 What is the effect of…
A: ROA is return on assets ratio, which is one of the profitability ratio which shows how much net…
Q: Year Net Income Cumulative (Loss) Net Income 2018 6,500,000 6,500,000 2019 400,000 What is the…
A: Cumulative income = Net income for 2018 + Net income for 2019
Q: VERTICAL ANALYSIS ZIVVY'S CLOTHING CORPORATION BALANCE SНЕЕТ DEC 31,2019 – DEC 31,2020 ACCOUNTS 2019…
A: Balance sheet of Zivvys clothing corporation for the year 2019 and 2020 are given.
Q: COMPANY A RATIO 2019 2018 Liquidity 1 Current Ratio 2 Quick Ratio Profitability 3 ROE 4 ROA 0.67…
A: Ratio analysis is the analysis in which ratios are compared for different periods and companies.
Q: (In millions) 2019 2018 2017 2016 Revenue $ 9,610 $ 9,355 $ 9,050 $ 8,950 Net Income 7,290 6,790…
A: Formula: 2017 year value = ( 2017 value / 2016 value ) x 100
Q: How do I determine the NNO for 2014?
A: Given information is: As on Dec 31, 2014 NOA = $397,299 Equity = $726,328
Q: . Following are balances from the books of East & West Insurance on 31/12/2017 (in JDs); Reinsurance…
A: Income statement refers to those financial statements of the company that depicts the revenues and…
Q: Balance Sheets At December 31 2018 2017 2018 2017 Assets: $ 24,640 $ 23,040 32,180 73,125 55,900…
A: Cash Flow Statement is the part of Financial Statement which shows the net increase/decrease in Cash…
Q: Required: a. Calculate ROI for 2014. Round your percentage answer to two decimal places. b.…
A: Return on Investment (ROI) is used to measure overall profitability of the business. It can be…
Q: (2) Diminishing-balance using double the straight-line rate for 2017 through to 2021. 2017 expense…
A: Depreciation :—The monetary value of an asset decreases over time due to use, wear and tear or…
Q: adjusted balance of accounts payable on December 31, 2021?
A: Answer: Unadjusted Balance of Accounts payable as on Dec 31,2021…
Q: CALCULATE THE EBITDA For the year ended December 31, Notes 2020 2019 Revenue ₱…
A: Income statement is a statement which is prepared to reflect the financial performance of an…
Q: Fill in the missing values A through D in the table for a loan of $10,000, if the interest rate is…
A: Compound Interest is the interest on a deposit or loan that is calculated on the initial principal…
Q: Comment on the following ratios that have been calculated for Mersat Limited. Provide two…
A: Return on assets indicates that the manner in which the company is profitable relative to its assets…
Q: Requirement 1. Compute Aim's Companies' current ratio at May 31, 2018 and 2017. Begin by selecting…
A: Current Ratio=Current AssetsCurrent Liabilities Answer 1: 2017: Current Ratio=26,30013,000=2.02:1…
Q: 2020 2019 Current ratio Did the company's ability to pay its current liabilities improve over the…
A: Current ratio of the company is an indicator or liquidity position of business, which shows or…
Q: s Reported Annual Balance Sheet eport Date 2019 2018 2017 2016 Thousands 399,000 1,179,000 1,706,000…
A: Financial leverage tells about the company’s dependency on borrowings and how it generates its…
Q: ________1. On 2020, an entity made cash sales of ₱3,000,000. It paid ₱1,000,000 in expenses and owed…
A: Net Profit = Sales - Total Expenses Note: Expense includes both cash expense and credit expense
Q: 3.Net income for 2020 was P1,825,600. In 2021, it decreased by 53%. Still using the 2020 net income…
A: The term Net income refers to the excess of revenue over the expenses, it increases owners equity.…
Q: Balance Sheet Data Assets 2019 2018 2017 Liabilities 2019 2018 2017 Cash & C.E. Acct. Rec…
A: Common size analysis is a tool which is used by managers to evaluate the percentage of various…
Q: (Pre faration of Opein ting Activit, section-Dipect imethod) Krauss company's income statement for…
A: Direct method of cash flows statement indicates the cash inflows and cash outflows related…
Q: Dther balances extracted from the books of Barney and Swiper include: Capital Accounts Barney 60 000…
A: Features of a partnership: Partnership can only be formed when there are more than 2 persons…
Q: Comment on the changes between these two years. What do the changes in ROE mean? What does such a…
A: Return on equity (ROE) is the measure of financial performance, which is calculated by dividing the…


Trending now
This is a popular solution!

Step by step
Solved in 2 steps


- Debra is considering investing in a company's stock and is aware that the return on that investment is particularly sensitive to how the economy is performing. Her analysis suggests that four states of the economy can affect the return on the investment.Use the following table of returns and probabilities to determine the coefficient of variation for the investment. (Round answer to 5 decimal places, e.g. 0.07680.) Probability Return Boom 0.2 25.00% Good 0.4 15.00% Level 0.3 10.00% Slump 0.1 -5.00%As an analyst for a domestic equity–income mutual fund, Robert Ass is evaluating Mosah Water Company (MWC), a publicly traded water utility, for possible inclusion in the approved list of investments. Robert Ass is conducting the analysis in mid-2013. Not all countries have traded water utility stocks. In developed economies such as the United States, about 85 percent of the population gets its water from government entities. A group of investor-owned water utilities, however, also supplies water to the public. With a market capitalization of about GH¢327 million as of mid-2013, MWC is among the ten largest publicly traded water utilities. MWC’s historical base is the Middlesex System, serving residential, industrial, and commercial customers in a well-developed area of central business district. Through various subsidiaries, MWC also provides water and wastewater collection and treatment services to areas of southern sectors. Hampered by a decline in earnings during the recent…As an analyst for a domestic equity–income mutual fund, Robert Ass is evaluating Mosah Water Company (MWC), a publicly traded water utility, for possible inclusion in the approved list of investments. Robert Ass is conducting the analysis in mid-2013. Not all countries have traded water utility stocks. In developed economies such as the United States, about 85 percent of the population gets its water from government entities. A group of investor-owned water utilities, however, also supplies water to the public. With a market capitalization of about GH¢327 million as of mid-2013, MWC is among the ten largest publicly traded water utilities. MWC’s historical base is the Middlesex System, serving residential, industrial, and commercial customers in a well-developed area of central business district. Through various subsidiaries, MWC also provides water and wastewater collection and treatment services to areas of southern sectors. Hampered by a decline in earnings during the recent…
- As an analyst for a domestic equity–income mutual fund, Robert Ass is evaluating Mosah Water Company (MWC), a publicly traded water utility, for possible inclusion in the approved list of investments. Robert Ass is conducting the analysis in mid-2013. Not all countries have traded water utility stocks. In developed economies such as the United States, about 85 percent of the population gets its water from government entities. A group of investor-owned water utilities, however, also supplies water to the public. With a market capitalization of about GH¢327 million as of mid-2013, MWC is among the ten largest publicly traded water utilities. MWC’s historical base is the Middlesex System, serving residential, industrial, and commercial customers in a well-developed area of central business district. Through various subsidiaries, MWC also provides water and wastewater collection and treatment services to areas of southern sectors. Hampered by a decline in earnings during the recent…Suppose that, as a fund manager, you purchase 5,000 shares of Company X on 1 January 2019 for $10 each in order to keep and earn dividends. Simultaneously, you also purchase 4,000 shares of Company Y for $7.5 each for trading purposes. The share price of Company X increases to $12 first, but after some days it drops to $11.2 and you immediately sell 3,000 shares. On the other hand, the share price of Company Y drops to $7 first, but after some days it increases to $7.6 and you immediately sell 2,500 shares. (Note that, funds make valuation on a daily basis) Assuming that there are no more price movements throughout the year, what would be the total comprehensive income as of the year end? A) $2,400B) $4,000C) $6,400D) $7,100E) Other (Please Specify)You have been asked by your employers to demonstrate your knowledge in business valuation process, by analyzing the value of Best Group Savings and Loans Company (BGSLC). The company paid a dividend of GH¢ 250,000 this year. The current return to shareholders of companies in the same industry as BGSLC is 12%, although it is expected that an additional risk premium of 2% will be applicable to BGSLC, being a smaller and unquoted company. Compute the expected valuation of BGSLC, if: The current level of dividend is expected to continue into the foreseeable future The dividend is expected to grow at a rate 4% par into foreseeable future The dividend is expected to grow at a 3% rate for three years and 2% afterwards
- (Using the CAPM to find expected returns) Sante Capital operates two mutual funds headquartered in Houston, Texas. The firm is evaluating the stock of four different firms for possible inclusion in its fund holdings. As part of their analysis, Sante's managers have asked their junior analyst to estimate the investor-required rate of return on each firm's shares using the CAPM and the following estimates: The rate of interest on short-term U.S. Treasury securities is currently 4 percent, and the expected return for the market portfolio is 10 percent. What should be the expected rates of return for each investment? Security Beta A 1.67 B 0.58 C 1.14 D 0.78 (Click on the icon in order to copy its contents into a spreadsheet.) Question content area bottom Part 1 a. The expected rate of return for security A, which has a beta of 1.67, is enter your response here%. (Round to two decimal places.) Part 2 b. The expected…During an interview with her investment adviser, a retired investor made the following two statements:a. “I have been very pleased with the returns I’ve earned on Petrie stock over the past two years and I am certain that it will be a superior performer in the future.”b. “I am pleased with the returns from the Petrie stock because I have specific uses for that money. For that reason, I certainly want my retirement fund to continue owning the Petrie stock.”Identify which principle of behavioral finance is most consistent with each of the investor’s two statements.You are considering a stock investment in one of two firms (LotsofDebt, Inc. and LotsofEquity, Inc.), both of which operate in the same industry. LotsofDebt, Inc. finances its $38.00 million in assets with $33.75 million in debt and $4.25 million in equity. LotsofEquity, Inc. finances its $38.00 million in assets with $4.25 million in debt and $33.75 million in equity. Calculate the debt ratio. (Round your answers to 2 decimal places.) Calculate the equity multiplier. (Round your answers to 2 decimal places.) Calculate the debt-to-equity. (Round your answers to 2 decimal places.)
- How is AIC currently valued in the stock market? (under, over, fairly) Your firm's client makes her investment decisions based on research report and requires 30% margin safety. What would be her investment decision if AIC price falls to $40?You are tasked with comparing two Icelandic equity funds. The other fund is called the RU IS Equity Fund (RIS). The other fund is called HÍ IS Equity Fund (HIS). It is known that the funds had the following ratios in certain shares over the period 2018 to 2021 (it is not assumed that they received dividends during the period). The proportions did not change over the period. The price of individual shares over the period can be found in the red box down below the text. a) What was the average annual return of RIS and HIS over the periodRaymond Reddington is a sell-side analyst for JP Morgan and covers the electronics industry. Based on his experience, he believes the appropriate way to model the intrinsic value of companies in this industry is the following weighted average: 25% dividend discount model, 40% P/E multiple, and 35% P/Book multiple. He has the following information at his disposal in his attempt to value Great Gadgets. For FY 19, Great Gadgets has $350M of liabilities and $400M in assets. Great Gadgets had $200M in sales, COGS were $115M, and SG&A expenses were $35M. Depreciation was $10M and Great gadgets paid taxes of $10M and interest on its debt of $5M. Great Gadgets has 2M shares outstanding. Great Gadgets has a beta of 0.9. The risk-free rate is 4% and the expected return of the market is 10%. Raymond expects them to issue dividends of $6, $9, and $11 in exactly 1 year, 2 years, and 3 years, respectively. After that, he expects dividends to increase by 3% per year indefinitely. Raymond…