COMPANY A RATIO 2019 2018 Liquidity 1 Current Ratio 2 Quick Ratio Profitability 3 ROE 4 ROA 0.67 1.07 0.53 1.09 6.74% 8.65% 5.08% 18.78% 3.43% 5 GPM 17.25% 6 OPM 7 NPM 5.74% 4.99% 3.62% 3.77% Leverage 8 Debt Ratio 9 Debt to Equity Ratio 10 Time Interest Earned Ra Efficiency 11 A/R Turnover Ratio 12 Average Collection Perid 13 Inventory Turnover Ratid 14 Average Age of Inventor 15 Accounts Payable Ratio 16 Average Age of Payable 17 Operating Cycle 0.72 0.67 1.42 1.15 3.98 4.94 36.11 40.34 10 9 16.00 16.93 22 21 10.86 6.91 33 52 32 30 18 Cash Conversion Cycle -1 -22 19 Total Asset Turnover Ra 20 Fixed Asset Turnover Ra 1.06 1.34 6.06 6.78
COMPANY A RATIO 2019 2018 Liquidity 1 Current Ratio 2 Quick Ratio Profitability 3 ROE 4 ROA 0.67 1.07 0.53 1.09 6.74% 8.65% 5.08% 18.78% 3.43% 5 GPM 17.25% 6 OPM 7 NPM 5.74% 4.99% 3.62% 3.77% Leverage 8 Debt Ratio 9 Debt to Equity Ratio 10 Time Interest Earned Ra Efficiency 11 A/R Turnover Ratio 12 Average Collection Perid 13 Inventory Turnover Ratid 14 Average Age of Inventor 15 Accounts Payable Ratio 16 Average Age of Payable 17 Operating Cycle 0.72 0.67 1.42 1.15 3.98 4.94 36.11 40.34 10 9 16.00 16.93 22 21 10.86 6.91 33 52 32 30 18 Cash Conversion Cycle -1 -22 19 Total Asset Turnover Ra 20 Fixed Asset Turnover Ra 1.06 1.34 6.06 6.78

Financial & Managerial Accounting
13th Edition
ISBN:9781285866307
Author:Carl Warren, James M. Reeve, Jonathan Duchac
Publisher:Carl Warren, James M. Reeve, Jonathan Duchac
Chapter15: Financial Statement Analysis
Section: Chapter Questions
Problem 15.17EX: Profitability ratios The following selected data were taken from the financial statements of...

Related questions
Question
Base on the financial ratios of company A, what is your recommendations and conclusion for company A.
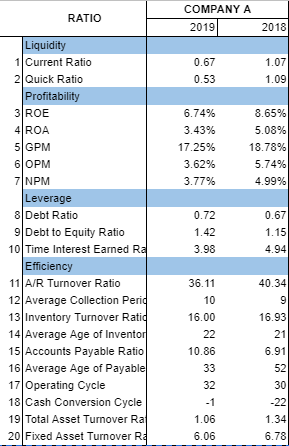
Transcribed Image Text:COMPANY A
RATIO
2019
2018
Liquidity
1 Current Ratio
0.67
1.07
2 Quick Ratio
0.53
1.09
Profitability
3 ROE
4 ROA
6.74%
8.65%
3.43%
5.08%
5 GPM
6 OPM
7 NPM
Leverage
8 Debt Ratio
9 Debt to Equity Ratio
10 Time Interest Earned Ra
17.25%
18.78%
3.62%
5.74%
3.77%
4.99%
0.72
0.67
1.42
1.15
3.98
4.94
Efficiency
11 A/R Turnover Ratio
12 Average Collection Perid
13 Inventory Turnover Ratid
14 Average Age of Inventor
15 Accounts Payable Ratio
16 Average Age of Payable
17 Operating Cycle
18 Cash Conversion Cycle
19 Total Asset Turnover Rat
20 Fixed Asset Turnover Ra
36.11
40.34
10
9
16.00
16.93
22
21
10.86
6.91
33
52
32
30
-1
-22
1.06
1.34
6.06
6.78
Expert Solution
This question has been solved!
Explore an expertly crafted, step-by-step solution for a thorough understanding of key concepts.

Step by step
Solved in 2 steps

Knowledge Booster


Learn more about
Need a deep-dive on the concept behind this application? Look no further. Learn more about this topic, accounting and related others by exploring similar questions and additional content below.Recommended textbooks for you
Financial & Managerial Accounting
Accounting
ISBN:
9781285866307
Author:
Carl Warren, James M. Reeve, Jonathan Duchac
Publisher:
Cengage Learning
Financial & Managerial Accounting
Accounting
ISBN:
9781285866307
Author:
Carl Warren, James M. Reeve, Jonathan Duchac
Publisher:
Cengage Learning