erence the F table.)   Razor   Blazer   Tracer   11       11       9     10       9       9     8       11       10     10       10       9     9       11       8     9       10       7     13       11       8     11       8       9          Click here for the Excel Data File   a. Specify the competing hypotheses to test

MATLAB: An Introduction with Applications
6th Edition
ISBN:9781119256830
Author:Amos Gilat
Publisher:Amos Gilat
Chapter1: Starting With Matlab
Section: Chapter Questions
Problem 1P
icon
Related questions
Question
Item7

3.33points

 
eBook

Item 7

Wenton Powersports produces dune buggies. They have three assembly lines, “Razor,” “Blazer,” and “Tracer,” named after the particular dune buggy models produced on those lines. Each assembly line was originally designed using the same target production rate. However, over the years, various changes have been made to the lines. Accordingly, management wishes to determine whether the assembly lines are still operating at the same average hourly production rate. Production data (in dune buggies/hour) for the last eight hours are as follows. (You may find it useful to reference the F table.)


Razor   Blazer   Tracer
  11       11       9  
  10       9       9  
  8       11       10  
  10       10       9  
  9       11       8  
  9       10       7  
  13       11       8  
  11       8       9  


 Click here for the Excel Data File


a. Specify the competing hypotheses to test whether there are some differences in the mean production rates across the three assembly lines.


multiple choice

  • H0μRazor = μBlazer = μTracerHA: Not all population means are equal.
  • H0μRazor ≤ μBlazer ≤ μTracerHA: Not all population means are equal.
  • H0μRazor ≥ μBlazer ≥ μTracerHA: Not all population means are equal.
     

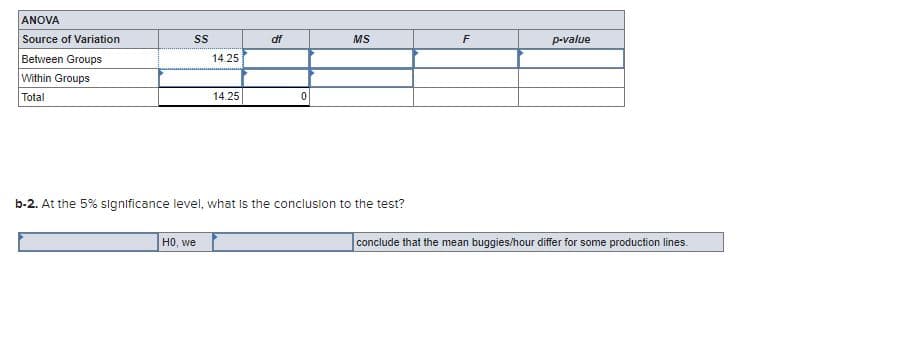
    b-1. Construct an ANOVA table. Assume production rates are normally distributed. (Round intermediate calculations to at least 4 decimal places. Round "SS" to 2 decimal places, "MS", "p-value" to 4 decimal places, and "F" to 3 decimal places.)


ANOVA
Source of Variation
Between Groups
Within Groups
Total
SS
14.25
HO, we
14.25
df
0
MS
b-2. At the 5% significance level, what is the conclusion to the test?
F
p-value
conclude that the mean buggies/hour differ for some production lines.
Transcribed Image Text:ANOVA Source of Variation Between Groups Within Groups Total SS 14.25 HO, we 14.25 df 0 MS b-2. At the 5% significance level, what is the conclusion to the test? F p-value conclude that the mean buggies/hour differ for some production lines.
Expert Solution
trending now

Trending now

This is a popular solution!

steps

Step by step

Solved in 2 steps with 2 images

Blurred answer
Recommended textbooks for you
MATLAB: An Introduction with Applications
Statistics
ISBN:
9781119256830
Author:
Amos Gilat
Publisher:
John Wiley & Sons Inc
Probability and Statistics for Engineering and th…
Statistics
ISBN:
9781305251809
Author:
Jay L. Devore
Publisher:
Cengage Learning
Statistics for The Behavioral Sciences (MindTap C…
Statistics
ISBN:
9781305504912
Author:
Frederick J Gravetter, Larry B. Wallnau
Publisher:
Cengage Learning
Elementary Statistics: Picturing the World (7th E…
Statistics
ISBN:
9780134683416
Author:
Ron Larson, Betsy Farber
Publisher:
PEARSON
The Basic Practice of Statistics
Statistics
ISBN:
9781319042578
Author:
David S. Moore, William I. Notz, Michael A. Fligner
Publisher:
W. H. Freeman
Introduction to the Practice of Statistics
Statistics
ISBN:
9781319013387
Author:
David S. Moore, George P. McCabe, Bruce A. Craig
Publisher:
W. H. Freeman