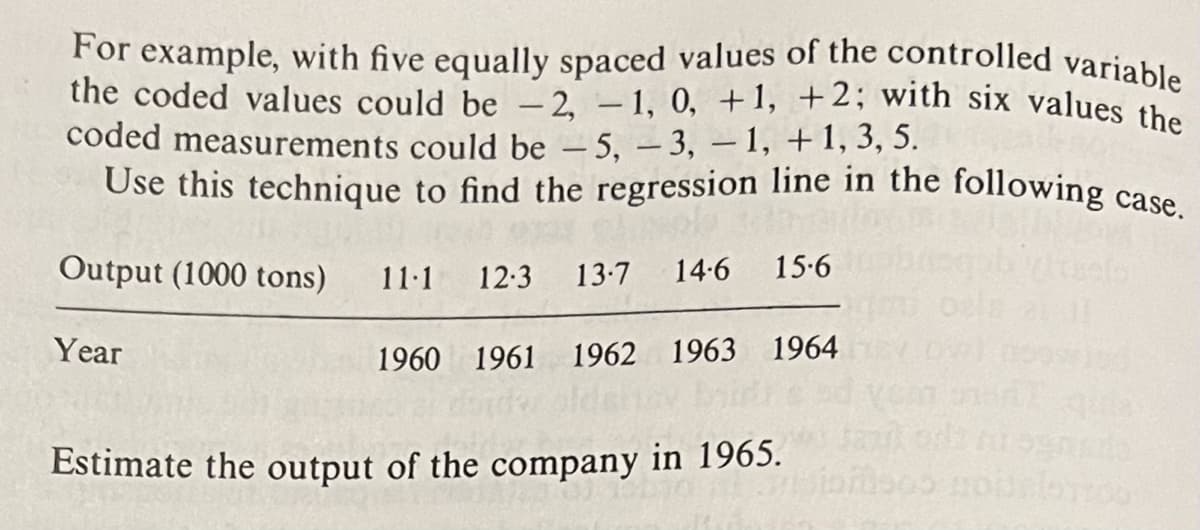
Estimate the output of the company in 1965.


Q: Use the sample data and confidence level given below to complete parts (a) through (d). A research…
A: Given info: Here, n = 1087, x = 597, and CL = 0.95
Q: Use the normal approximation to the binomial to find the probability for =n=51, p0.9, and ≤X40…
A: The following information has been provided: n=51p=0.9 q=1-p =1-0.9 =0.1 We need to compute…
Q: A sample mean, sample standard deviation, and sample size are given. Use the one-mean t-test to…
A:
Q: South Salinas Price 599 465 595 1185 640 566 499 611 439 512 999 755 405 650 489 652 629 420 639 482…
A: Here to test the linear correlation between price & square feet in south Salinas So ; using…
Q: . A sample mean, sample standard deviation, and sample size are given. Use the one-mean t-test to…
A: GivenMean(x)=7.1standard deviation(s)=2.3sample size(n)=18α=0.01The null and alternative hypothesis…
Q: From a sample of 200 bread rolls from Ideal bakery, 95 of the were wheat. The manager of the bakery…
A: Solution-: Given: n=200,x=95,P0=0.49 We want to find, (a) The 95% confidence interval for the…
Q: INSTRUCTION: Perform an appropriate statistical test using the dataset (Sheet name: Fruits) if a…
A: Given Information: Consider the given dataset: W X Y Z A 6.9 11 13.1 13.4 11.8 7.8 12.1…
Q: 3) Use the regression equation to predict the price of a 2000 square foot house in South Salinas.
A: From the above question 3 3) Use the regression equation to predict the price of a 2000 square…
Q: Distinguish between the Population Regression Function (PRF) and the Sample Regression Function…
A: Solution: According to the guidelines if the multiple questions asked first question should be…
Q: Wageweb conducts surveys of salary data and presents summaries on its Web site. Based on salary data…
A: Disclaimer: Since you have posted a question with multiple sub-parts, we will solve the first three…
Q: Which of the following statements is NOT correct about standard normal distribution (normal…
A: Suppose, Z is standard normal distribution. Z ~ N(0,1) a. Proportion of extreme values for a normal…
Q: IQ scores or normally distributed with the mean of 100 and a standard deviation of 15. A simple…
A: GivenMean(μ)=100standard deviation(σ)=15sample size(n)=13standard deviation(s)=7.2significance…
Q: Question 13 What is the difference between trendline and linest function? we can use data from…
A: In first part We have to tell about Trend line and Linest function. In second part We have to tell…
Q: A survey found that women’s heights are normally distributed with mean 63.8 in and a standard…
A: GivenMean(μ)=63.8standard deviation(σ)=2.2a branch of the military requires women's heights to be…
Q: 11. Given two events, A and B. Find the following if P(A)=0.7, P(B)=0.5, and P(A U B)=0.9. Complete…
A: Given: P(A) = 0.7 P(B) = 0.5 P(AUB) = 0.9 Formula Used: P(A∩B) = P(A)+P(B)-P(A∪B) P(A∪B)' = 1-P(A∪B)…
Q: You wish to test the following claim (Ha) at a significance level of a = 0.10. Ho:μ = 76.3 Ha: μ <…
A: Given : To test : Ho:μ=76.3 VS Ha:μ<76.3 This is left tailed test Population is…
Q: 4) Test the claim that the majority of Precalculus students are passing the class with a C or…
A: The objective is to test the claim that the majority of precalculus students are passing the class…
Q: You measure 27 randomly selected textbooks' weights, and find they have a mean weight of 51 ounces.…
A:
Q: In a sample of 100 voters from the same state, who voted for either the Democratic or Republican…
A: Given: Sample size, n is 100 The number of voters voted for Democratic candidate for governor is 55.…
Q: State the null hypothesis H0 and the alternative hypothesis H1 . H0: H1: (b) Determine the type of…
A: It is given that Sample size n = 155 Number of babies weigh more than 7 pounds, X = 88 Level of…
Q: The table below shows the value V , in dollars, of a certain rare coin t years since 1950. t 0…
A: In regression analysis, the value of a variable is predicted using the value(s) of another…
Q: You wish to test the following claim (Ha) at a significance level of a=0.10. Ho:μ = 76.3 Hai p <…
A: Given, Sample size = n = 72 Sample mean = M = 72.5 Sample standard deviation = SD = 8.7 Hypothesis :…
Q: In a random sample of 18 people, the mean commute time to work was 32.2 minutes and the standard…
A:
Q: Q6. The outcome variable in a linear regression is best measured on which of the following scales?…
A: In linear regression, there is one dependent variable (y) and one or more independent variable(s)…
Q: 3. A survey of a sample of 637 people is conducted. The survey's respondents are classified…
A:
Q: If you want to make a confidence interval for the mean with the TI-84, which of the following…
A: Given that, The sample standard deviation(s) is known The function of Z-test is not correct because…
Q: A sample of people have their income measured in dollars per year. Robin gets a deviation of +5 on…
A: Given: A sample of people have their income measured in dollars per year. Robin gets a deviation of…
Q: Find the probability distribution for Y. The table for the probability distribution of Y may have…
A: Here, f(x) = x^2/10, x = -2,-1,0,1,2 Y = X^2 + 1
Q: Find the expected counts in each category using the given sample size and null hypothesis. Ho: P1 P2…
A: From the provided information, The null hypothesis is as follow: H0 = p1 = p2 = p3 = p4 = 0.25…
Q: Use a t-distribution to find a confidence interval for the difference in means μ = μ₁-₂ using the…
A: From the provided information, Sample size (n) = 8
Q: For the following Before/After data, calculate the t-obtained for a Related-Samples t-test. a. 2.53…
A:
Q: Describe the statistical methods and statistical techniques listed below. For each of these…
A: Marketing opportunities are instances in favor of a company to sell something to a certain type of…
Q: z-score cuts off the top 65% of the distribution? a. z = 0.7422 b. z = 0.2578 c. z =0.39 d. z =…
A: Given that. X~N( 0 , 1 ) μ=0 , ?=1 (for standard normal distribution) Z-score =( x - μ )/?
Q: Let x and y be the sample means for two variable x and y. The centered x-data and the centered…
A: Let us denote Distance by X and Amplitude by Y respectively. The centered data for X and Y is…
Q: College Students and Paying Jobs Exercise 2.16 introduces data from a survey that included 5204…
A: Hey there! Thank you for posting the question. Since there are multiple questions posted, we will…
Q: A random sample of 13 hotels in Boston had an average nightly room rate of $172.10 with a sample…
A:
Q: A coach uses a new technique in training middle distance runners. The times for 8 different athletes…
A: For the given data Perform t test for dependent samples
Q: In 2002, the mean age of an inmate on death row was 40.7 years with a standard deviation of 9.6…
A: Given,sample mean(x¯)=38.9population standard deviation(σ)=9.6sample…
Q: The height of all 3-year-old females is approximately normal with a mean of 38.72 inches and a…
A:
Q: Q10. Confounding occurs when” a. the confounding variable is related to none of the other…
A:
Q: 2. At Passmore University (PU) there are 600 students taking Physics or Calculus. 154 are taking…
A: The following information has been given: Let P represents Physics C represents Calculus…
Q: tandard deviation of $1995. Is there enough evidence to reject the claim at a = 0.01? Complete parts…
A: A random sample of 22 vehicles has mean price 20634 and standard deviation is 1995…
Q: What is the value of Σ(X2 + 2) for the following scores? Scores: 9, 10, 8, 6, 5, 9, 6, 5 a. 450…
A:
Q: : Suppose we change the original problem in Exercise 3 to see what happens to the error bound if the…
A: The sample sizes are 28 and 40.
Q: What is the probability that a randomly selected payment is between $880 and $1140
A: Let X denote monthly student loan payment for those with an advanced degree. Given that X follows…
Q: The categories of a categorical variable are given along with the observed counts from a sample. The…
A: The given table is,
Q: Travelocity would like to test if the average roundtrip airfare between New York and London is less…
A: Dear student, If you find this solution helpful please upvote ? it.
Q: a) A new machine is used to pack coffee powder. The mass of a packet follows a normal distribution…
A: The mean and standard deviation for the sample data are computed as follows:
Q: Good morning, I understand how to get P&Q and an x, the only portion I don't understand is for…
A: Given A binomial distribution, we need to explain how we are getting the terms 1,6,15,20 and so on…
Q: The National Center for Education Statistics would like to test the hypothesis that the proportion…
A:

Step by step
Solved in 2 steps with 2 images

- Olympic Pole Vault The graph in Figure 7 indicates that in recent years the winning Olympic men’s pole vault height has fallen below the value predicted by the regression line in Example 2. This might have occurred because when the pole vault was a new event there was much room for improvement in vaulters’ performances, whereas now even the best training can produce only incremental advances. Let’s see whether concentrating on more recent results gives a better predictor of future records. (a) Use the data in Table 2 (page 176) to complete the table of winning pole vault heights shown in the margin. (Note that we are using x=0 to correspond to the year 1972, where this restricted data set begins.) (b) Find the regression line for the data in part ‚(a). (c) Plot the data and the regression line on the same axes. Does the regression line seem to provide a good model for the data? (d) What does the regression line predict as the winning pole vault height for the 2012 Olympics? Compare this predicted value to the actual 2012 winning height of 5.97 m, as described on page 177. Has this new regression line provided a better prediction than the line in Example 2?8)Suppose that Y is normal and we have three explanatory unknowns which are also normal, and we have an independent random sample of 11 members of the population, where for each member, the value of Y as well as the values of the three explanatory unknowns were observed. The data is entered into a computer using linear regression software and the output summary tells us that R-square is 0.86, the linear model coefficient of the first explanatory unknown is 7 with standard error estimate 2.5, the coefficient for the second explanatory unknown is 11 with standard error 2, and the coefficient for the third explanatory unknown is 15 with standard error 4. The regression intercept is reported as 28. The sum of squares in regression (SSR) is reported as 86000 and the sum of squared errors (SSE) is 14000. From this information, what is MSE/MST? .5000 NONE OF THE OTHERS .2000 .3000 .400017) Suppose that Y is normal and we have three explanatory unknowns which are also normal, and we have an independent random sample of 41 members of the population, where for each member, the value of Y as well as the values of the three explanatory unknowns were observed. The data is entered into a computer using linear regression software and the output summary tells us that R-square is 0.9, the linear model coefficient of the first explanatory unknown is 7 with standard error estimate 2.5, the coefficient for the second explanatory unknown is 11 with standard error 2, and the coefficient for the third explanatory unknown is 15 with standard error 4. The regression intercept is reported as 28. The sum of squares in regression (SSR) is reported as 90000 and the sum of squared errors (SSE) is 10000. From this information, what is the number of degrees of freedom for the t-distribution used to compute critical values for hypothesis tests and confidence intervals for the individual…
- 9)Suppose that Y is normal and we have three explanatory unknowns which are also normal, and we have an independent random sample of 11 members of the population, where for each member, the value of Y as well as the values of the three explanatory unknowns were observed. The data is entered into a computer using linear regression software and the output summary tells us that R-square is 0.79, the linear model coefficient of the first explanatory unknown is 7 with standard error estimate 2.5, the coefficient for the second explanatory unknown is 11 with standard error 2, and the coefficient for the third explanatory unknown is 15 with standard error 4. The regression intercept is reported as 28. The sum of squares in regression (SSR) is reported as 79000 and the sum of squared errors (SSE) is 21000. From this information, what is the adjusted R-square? .8 .7 NONE OF THE OTHERS .6 .5In a multiple regression problem involving two independent variables, if b1 is computed to be +2.0, it means that the relationship between X1 and Y is significant the estimated mean of Y increases by 2 units for each increase of 1 unit of X1, holding X2 constant. the estimated mean of Y increases by 2 units for each increase of 1 unit of X1, without regard to X2 the estimated mean of Y is 2 when X1 equals zero.If other factors are held constant and the Pearson correlation value between X and Y is r = 0.80, then the regression equation will tend to produce more accurate predictions than would be obtained if the Pearson correlation value was r = 0.60. True or False
- Suppose that a least squares regression line equation is ˆy = 1.65 − 2.20x and the actual y value corresponding to x = 10 is −19, what is the residual value corresponding to y = −19?If other factors are held constant, if the Pearson correlation between X and Y is r = 0.50, then the regression equation will produce more accurate predictions than would be obtained if r = 0.70. True or false?For variables x1, x2, x3, and y satisfying the assumptions for multiple linear regression inferences, the population regression equation is y = 27 – 4.7x1 + 2.3x2 + 5.8x3. For samples of size 20 and given values of the predictor variables, the distribution of the estimates of β1 for all possible sample regression planes is a _________ distribution with mean _________ and standard deviation _______.
- A regression line describes the relationship between the dependent and independent variables and can be used to estimate specific points for x or y, provided an individual is supplied with the values of all the other variables but one. True or falseSuppose there is 1 dependent variable (dissolved oxygen, Y) and 3 independent variables (water temp X1, depth X2, and hardness of water X3). Below is the result of the multiple linear regression.Which of the following is NOT true in the multiple linear regression outputs? In the F-test ANOVA result, if Ho is rejected, this means that the regression model overall predicts the dependent variable significantly well. If a predictor is having a significant impact on our ability to predict the outcome then the regression coefficient b should be significantly different from 1.0. The F-test ANOVA assesses all of the regression coefficients jointly whereas the t-test for each coefficient examines them individually. It is possible that a model is significant, but not enough to conclude that any individual variable is significant.If other factors are held constant and the Pearson correlation value between X and Y is r = 0.80, then the regression equation will tend to produce more accurate predictions than would be obtained if the Pearson correlation value was r = 0.60. Group of answer choices True False
