Estimated Demand Function:ln(Q) = -6.758 – 2.116ln(P) + 1.331ln(l) – 0.44ln(A) + 2.99ln(Psub) + 0.908ln(Pop) Suppose we decide to charge a per ounce price of $2, while at the same time our rival charges a price of $2.15. All else equal, what would you ex
Estimated Demand Function:ln(Q) = -6.758 – 2.116ln(P) + 1.331ln(l) – 0.44ln(A) + 2.99ln(Psub) + 0.908ln(Pop) Suppose we decide to charge a per ounce price of $2, while at the same time our rival charges a price of $2.15. All else equal, what would you ex

College Algebra (MindTap Course List)
12th Edition
ISBN:9781305652231
Author:R. David Gustafson, Jeff Hughes
Publisher:R. David Gustafson, Jeff Hughes
Chapter8: Sequences, Series, And Probability
Section8.7: Probability
Problem 58E: What is meant by the sample space of an experiment?

Related questions
Topic Video
Question
Estimated Demand Function:ln(Q) = -6.758 – 2.116ln(P) + 1.331ln(l) – 0.44ln(A) + 2.99ln(Psub) + 0.908ln(Pop)
- Suppose we decide to charge a per ounce price of $2, while at the same time our rival charges a price of $2.15. All else equal, what would you expect sales to be? How confident are you in your forecast?
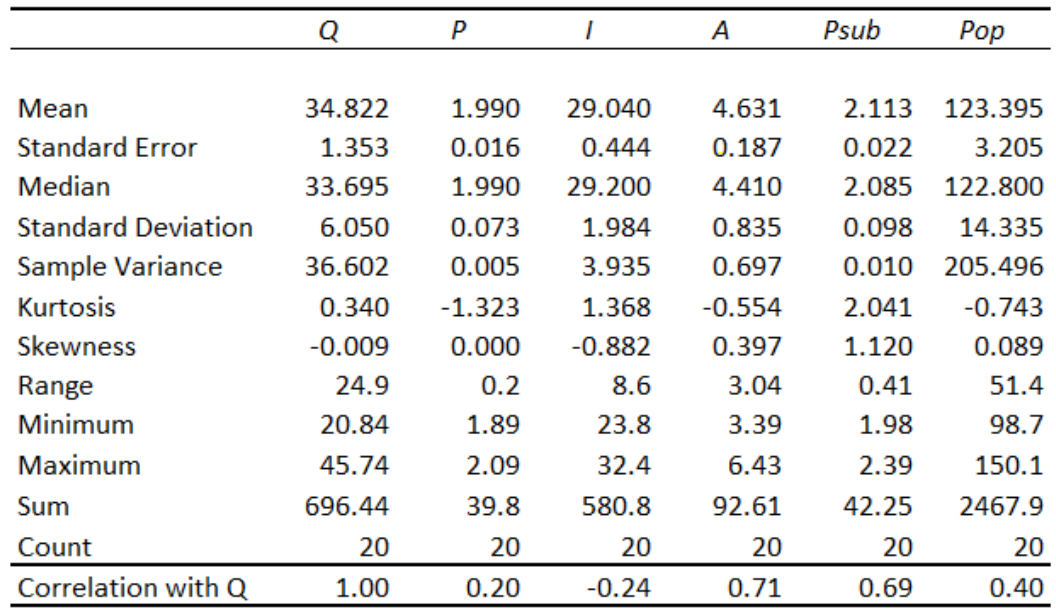
Transcribed Image Text:Q
A
Psub
Рop
Mean
34.822
1.990
29.040
4.631
2.113
123.395
Standard Error
1.353
0.016
0.444
0.187
0.022
3.205
Median
33.695
1.990
29.200
4.410
2.085
122.800
Standard Deviation
6.050
0.073
1.984
0.835
0.098
14.335
Sample Variance
36.602
0.005
3.935
0.697
0.010
205.496
Kurtosis
0.340
-1.323
1.368
-0.554
2.041
-0.743
Skewness
-0.009
0.000
-0.882
0.397
1.120
0.089
Range
24.9
0.2
8.6
3.04
0.41
51.4
Minimum
20.84
1.89
23.8
3.39
1.98
98.7
Maximum
45.74
2.09
32.4
6.43
2.39
150.1
Sum
696.44
39.8
580.8
92.61
42.25
2467.9
Count
20
20
20
20
20
20
Correlation with Q
1.00
0.20
-0.24
0.71
0.69
0.40
Expert Solution
This question has been solved!
Explore an expertly crafted, step-by-step solution for a thorough understanding of key concepts.

This is a popular solution!

Trending now
This is a popular solution!

Step by step
Solved in 2 steps

Knowledge Booster


Learn more about
Need a deep-dive on the concept behind this application? Look no further. Learn more about this topic, statistics and related others by exploring similar questions and additional content below.Recommended textbooks for you
College Algebra (MindTap Course List)
Algebra
ISBN:
9781305652231
Author:
R. David Gustafson, Jeff Hughes
Publisher:
Cengage Learning
College Algebra (MindTap Course List)
Algebra
ISBN:
9781305652231
Author:
R. David Gustafson, Jeff Hughes
Publisher:
Cengage Learning