ethat a survey containing 49 students from Ram ted to figure out how much time college students eek. In your sample, you find a sample mean on of 7 hours. onstruct a 90% confidence interval that would con ean of weekly time spent texting their friends
ethat a survey containing 49 students from Ram ted to figure out how much time college students eek. In your sample, you find a sample mean on of 7 hours. onstruct a 90% confidence interval that would con ean of weekly time spent texting their friends

MATLAB: An Introduction with Applications
6th Edition
ISBN:9781119256830
Author:Amos Gilat
Publisher:Amos Gilat
Chapter1: Starting With Matlab
Section: Chapter Questions
Problem 1P

Related questions
Question
Only question 4 needed thanks
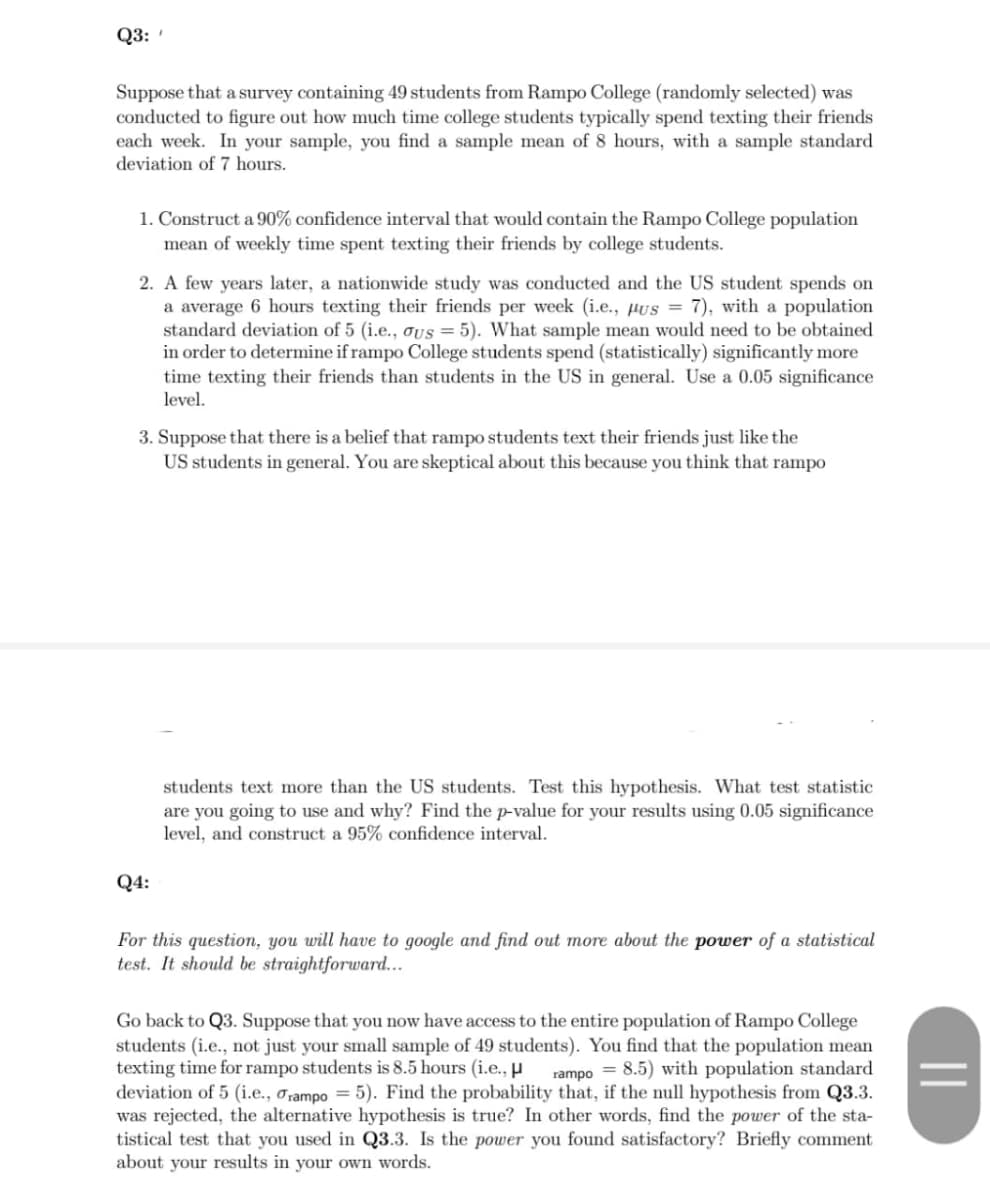
Transcribed Image Text:Q3:
Suppose that a survey containing 49 students from Rampo College (randomly selected) was
conducted to figure out how much time college students typically spend texting their friends
each week. In your sample, you find a sample mean of 8 hours, with a sample standard
deviation of 7 hours.
1. Construct a 90% confidence interval that would contain the Rampo College population
mean of weekly time spent texting their friends by college students.
2. A few years later, a nationwide study was conducted and the US student spends on
a average 6 hours texting their friends per week (i.e., µus = 7), with a population
standard deviation of 5 (i.e., oUs = 5). What sample mean would need to be obtained
in order to determine if rampo College students spend (statistically) significantly more
time texting their friends than students in the US in general. Use a 0.05 significance
level.
3. Suppose that there is a belief that rampo students text their friends just like the
US students in general. You are skeptical about this because you think that rampo
students text more than the US students. Test this hypothesis. What test statistic
are you going to use and why? Find the p-value for your results using 0.05 significance
level, and construct a 95% confidence interval.
Q4:
For this question, you will have to google and find out more about the power of a statistical
test. It should be straightforward...
Go back to Q3. Suppose that you now have access to the entire population of Rampo College
students (i.e., not just your small sample of 49 students). You find that the population mean
texting time for rampo students is 8.5 hours (i.e., µ
deviation of 5 (i.e., orampo = 5). Find the probability that, if the null hypothesis from Q3.3.
was rejected, the alternative hypothesis is true? In other words, find the power of the sta-
tistical test that you used in Q3.3. Is the power you found satisfactory? Briefly comment
about your results in your own words.
rampo = 8.5) with population standard
||
Expert Solution
This question has been solved!
Explore an expertly crafted, step-by-step solution for a thorough understanding of key concepts.

Step by step
Solved in 2 steps

Recommended textbooks for you
MATLAB: An Introduction with Applications
Statistics
ISBN:
9781119256830
Author:
Amos Gilat
Publisher:
John Wiley & Sons Inc

Probability and Statistics for Engineering and th…
Statistics
ISBN:
9781305251809
Author:
Jay L. Devore
Publisher:
Cengage Learning

Statistics for The Behavioral Sciences (MindTap C…
Statistics
ISBN:
9781305504912
Author:
Frederick J Gravetter, Larry B. Wallnau
Publisher:
Cengage Learning
MATLAB: An Introduction with Applications
Statistics
ISBN:
9781119256830
Author:
Amos Gilat
Publisher:
John Wiley & Sons Inc
Probability and Statistics for Engineering and th…
Statistics
ISBN:
9781305251809
Author:
Jay L. Devore
Publisher:
Cengage Learning
Statistics for The Behavioral Sciences (MindTap C…
Statistics
ISBN:
9781305504912
Author:
Frederick J Gravetter, Larry B. Wallnau
Publisher:
Cengage Learning

Elementary Statistics: Picturing the World (7th E…
Statistics
ISBN:
9780134683416
Author:
Ron Larson, Betsy Farber
Publisher:
PEARSON

The Basic Practice of Statistics
Statistics
ISBN:
9781319042578
Author:
David S. Moore, William I. Notz, Michael A. Fligner
Publisher:
W. H. Freeman

Introduction to the Practice of Statistics
Statistics
ISBN:
9781319013387
Author:
David S. Moore, George P. McCabe, Bruce A. Craig
Publisher:
W. H. Freeman