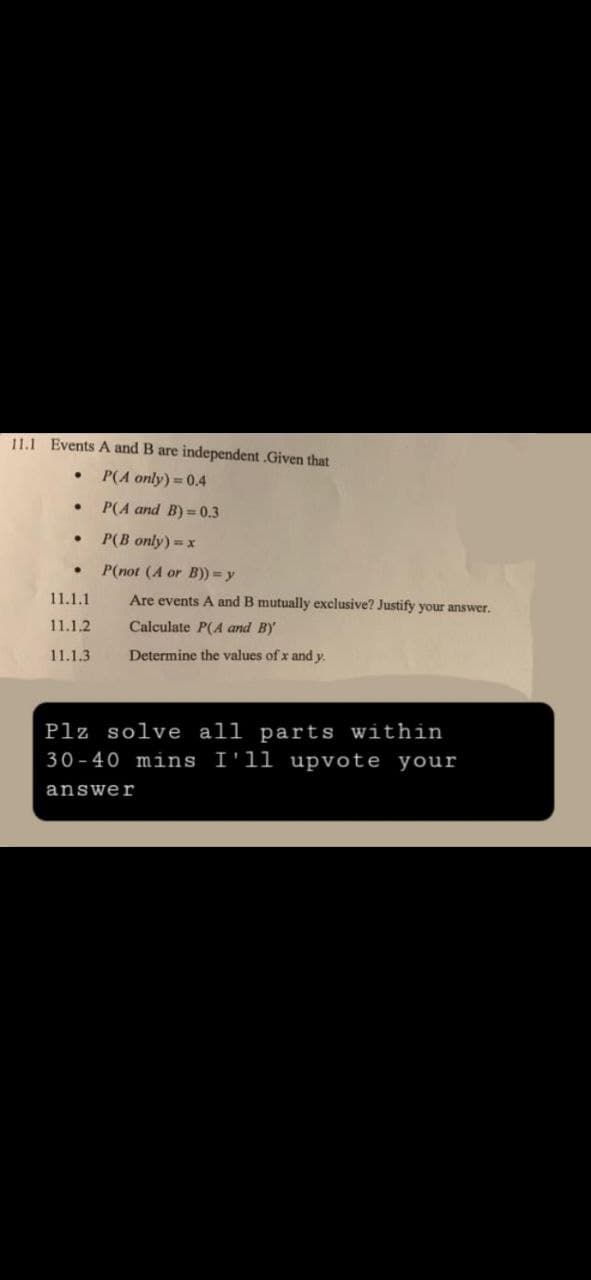
11.1 Events A and B are independent .Given that ● P(A only) = 0.4 P(A and B)= 0.3 P(B only) = x P(not (A or B)) = y Are events A and B mutually exclusive? Justify your answer. Calculate P(A and B) Determine the values of x and y. . ● • 11.1.1 11.1.2 11.1.3


Q: A local kitchen remodel shop works with the middle 74% of the market. The average cost of a kitchen…
A: Given that mean =22134 s.d = 3189 p value =0.74
Q: What is the Sample Variance for the following numbers: 52, 62, 52, 45, 41
A: Solution-: Given data: 52, 62, 52, 45, 41 We want to find the sample variance?
Q: Find the equation of the regression line for the given data. Then construct a scatter plot of the…
A:
Q: Class Interval 144-149 f 5
A: Given that
Q: A fair 12-sided die is tossed. Find P(4 or at least 5). That is, find the probability that the…
A: Solution-: A fair 12 sided die is tossed. We want to find, P(4 or at least 5 )=?
Q: The average number of dropouts for a school district has been 305 per year with a standard devia-…
A:
Q: Consider the hypothesis test Ho: o2 = 02 against H₁: o² <o2 respectively. Suppose that the sample…
A: We need to test the hypothesis: Ho : σ12 = σ22 Ha : σ12 < σ22
Q: X P(x) 0 0.662 When conducting research on color blindness in males, a researcher forms random…
A:
Q: Use the chi-square distribution for the ff. tests: The School conducted a survey regarding the…
A:
Q: a certain group claims that at least 65% of the residents of their barangay have household pets. to…
A: The following information has been given: The sample size is n=250. The number of residents who have…
Q: (a) What is the class width? 0 (b) How many concerts were attended by from 300 to 424 people? 0 (c)…
A: a) The class width is obtained by finding the difference between two lower-class limits or two upper…
Q: What is the variance, σ2, in the weights of dogs shown in the table below?
A:
Q: Which of the following sampling methods was used in the study described below? A researcher is…
A: There are various types of sampling procedures, which can be categorized into two groups:…
Q: The following is the age distribution of 1,000 persons working in a large industrial house:…
A:
Q: Problem 1: A diamond's price is determined by the Five Cs: cut, clarity, color, depth, and carat…
A: Regression line are used to determine the future value. It explain the relationship between…
Q: A random sample of 200 adults showed that 80 are already fully vaccinated. a) What is the best point…
A: It is given that sample size (n) is 200 and x is 80.
Q: deviation is defined as S = √√√S², and is commonly used as an estimator for a. Nevertheless, S is a…
A:
Q: For a normal distribution where the mean is 50 and the standard deviation is 10, what percentage of…
A:
Q: 8. Use the given information to find the P-value. Also, use a 0.05 significance level and state the…
A: Given that Hypothesis: H0: P=35 versus H1: p<35 l.o.s.=α=0.05 Test statistic Z=-1.68
Q: Recall to calculate the least-squares regression line for two datasets from the variables x and y,…
A: The simple linear regression is, ŷ = a + bx, where y is the dependent variable, x is the independent…
Q: A random sample of the number of educational projects in each of the regions of the country are as…
A: The following information has been given : 47,95,54,33,64,4,8,57,9,80,8,90,3,49,4,44 The sample size…
Q: Suppose that a company wishes to predict sales volume based on the amount of advertising…
A: Given : Estimated Sales Volume=46.67+0.46(Advertising Expenditures)
Q: A purple yam manufacturer claims that their containers contain 200 grams of yam. A random sample of…
A: Given that Sample size n =35 Sample mean =196 Population standard deviation =15
Q: thee workers' monthly salary follows a normal distribution. The avarage is $3,000 and the variance…
A: From the provided information, Mean (µ) = 3000 Variance (σ2) = 260000 X~N (3000, 260000) Here X be a…
Q: Researchers record the fuel consumption of a car y (in miles per gallon) at various speeds x (in…
A: The regression line is y=70.243-0.329x.
Q: The temperature distribution of Melbourne has a population mean μ = 25.01, and standard deviation o…
A:
Q: Use the given frequency distribution to find the (a) class width. (b) class midpoints. (c) class…
A: Given freq. distribution table is Temp.( 0F) Freq. 32-36 1 37-41 3 42-46 5 47-51 11…
Q: a statistical tool that shows the observed frequencies of two variables; one variable is listed in a…
A: It is given that the statements. Here, need to find out the correct choices for the given…
Q: Consider the hypothesis test Ho: a = o2 against H₁: o < o respectively. Suppose that the sample…
A:
Q: Answer #19: (median of given #5) Direction: Complete the table below by finding the mean, median and…
A: The objective is to find the mean, median and mode of each set of data. Mean is the average of a…
Q: Frank rented a truck for one day. There was a base fee of $17.95, and there was an additional charge…
A: Given : Base fee=$17.95 78 cents for each mile that is (78/100)$ Total amount paid=$118.57
Q: Find the shaded area underneath the Standard Normal curve. Give your answer to four decimal places.…
A: Given that. X~N( 0 , 1 ) μ=0 , ?=1 (for standard normal distribution) Z-score =( x - μ )/?
Q: Please show solution and explain. Researchers report in the AHA journal Hypertension that people…
A: We have given thatMean(µ) = 8Sample size (n) = 225Sample mean (x̅) = 8.5Standard deviations (s) =…
Q: 4.4 Consider the multiple regression model fit to the gasoline mileage data. TABLE B.3 Gasoline…
A: The given data has a dependent variable y and 11 independent variables. The data represents the gas…
Q: What can you say about the relationship between the standard deviation of the sample mean and the…
A: Explanation: According to central limit theorem, If the sample size increases i.e., (n≥30) then…
Q: If X has a normal distribution with mean 1 and variance 4, then P[X² - 2X ≤ 8]?
A:
Q: Assume that a randomly selected subject is given a bone density test. Those test scores are normally…
A:
Q: Q1/The following table represents the number of lectures on engineering statistics for the second…
A: Solution: From the given information,
Q: Real-life Problem Apply the concept of measures of central tendency, write your ANSWER with COMPLETE…
A: Mean, Median and Mode are the measures of central tendency. Mean uses all the observations for…
Q: blood pres pressu randomly males hown in the table below. Assume that the weight and blood pressure…
A: Given, Subject Weight(x) Systolic BP(y) 1 165 130 2 167 133 3 180 150 4 155 128 5 212…
Q: Create a Venn diagram that corresponds the following equivalent expression
A:
Q: Assume that a randomly selected subject is given a bone density test. Those test scores are normally…
A: The provided information is µ=0 σ=1 Then P(x<0)=?
Q: Find the indicated area under the standard normal curve. To the left of z=2.47 Click here to view…
A: The standard normal variable is z, which follows the normal distribution with the mean of 0 and…
Q: The dependent variable (X) and the independent variable (Z) have a negative relationship when the…
A:
Q: What is the average number of points you would expect to lose if you roll the die 60 times? b.…
A: Given : Number of times die is rolled =50 Lose a point if 1 is rolled
Q: Find the area of the shaded region. The graph depicts the standard normal distribution with mean 0…
A:
Q: 9. Two years ago 72% of household in a certain city regularly participated in recycling household…
A: “Since you have posted multiple question , we will solve first question for you. To get the…
Q: where Oso, using the factors Zation theorem, Tn = #x;, is a sufficient statisti Show That for 0. (21
A:
Q: The probabilities that the prices of 4 commodities – A, B, C and D – will increase within the next…
A: Solution
Q: Suppose X₁, X2,..., X30 is a random sample from a normal population with mean and variance 10. Find…
A:

Step by step
Solved in 2 steps with 1 images

- Repeat Example 5 when microphone A receives the sound 4 seconds before microphone B.A researcher conducts a hypothesis test using a sample from an unknown population. If df = 30 for the t-statistic and M = 46 and s2 = 10, how many individuals were in the sample?A medical researcher says that less than 74%of adults in a certain country think that healthy children should be required to be vaccinated. In a random sample of 600adults in that country, 71% think that healthy children should be required to be vaccinated. At α=0.01, is there enough evidence to support the researcher's claim? Complete parts (a) through (e) below. (a) Identify the claim and state H0 andHa. Identify the claim in this scenario. Select the correct choice below and fill in the answer box to complete your choice. (Type an integer or a decimal. Do not round.) Fill the percentage on the correct answer A. % of adults in the country think that healthy children should be required to be vaccinated. B. Less than %of adults in the country think that healthy children should be required to be vaccinated. C. The percentage of adults in the country who think that healthy children should be required to be vaccinated is not %. D. More than…
- A sample of n = 25 scores has a mean of M = 68. Find the z-score for the sample: If it was obtained from a population with u = 60 and o = 10, z = ? If it was obtained from a population with u = 60 and o = 20, z = ? If it was obtained from a population with u = 60 and o = 40, z = ?An SRS of 100 flights by Speedy Airlines showed that 64 were on time. An SRS of 100 flights by Happy Airlines showed that 80 were on time. Let pS be the proportion of on-time flights for all Speedy Airline flights, and let pH be the proportion of all on-time flights for all Happy Airlines flights. Is there evidence of a difference in the on-time rate for the two airlines? To determine this, you test the hypotheses H0 : pS – pH 0, Ha : pS – pH 0. The P-value of your test is 0.0117. Which of the following is an appropriate interpretation of the P-value? a. If the on-time rates for the two airlines are equal, there is a 0.0117 probability of getting samples with a difference as far or farther from zero as these samples. b. If the on-time rates for the two airlines are not equal, the probability of getting samples with a difference as far or farther from zero as these samples is 0.9883. c. The probability of making a Type I error is 0.0117. d. The probability of making a Type II error…Q15) A cookie jar containts 15 chocolate chip and 5 oatmeal cookies. If 3 cookies are randomly selected, what is the probablity at least one is an oatmeal cookie? (Find TWO METHODS to calculate this problem, and show the work)
- To increase egg production, a farmer decided to increase the number of times the lights in his henhouse were on. Ten hens were randomly selected, and the number of eggs each produced was recorded. After one week of lengthened light time, the same hens were monitored again. The data is given here. At α = 0.05, can it be concluded that the increased light time increased egg production? Hen 1 2 3 4 5 6 7 8 9 10 Before 4 3 8 7 6 4 9 7 6 5 After 6 5 9 7 4 5 10 6 9 6A researcher predicts that scores in treatment A will be higher than scores in treatment B. If the mean for the 10 participants in treatment A is 4 points higher than the mean for the 10 participants in treatment B and the data produce t = 2.095, what decision should be made? a. With a = .05, reject H0 for a one-tailed test but fail to reject for a two-tailed test b. With a = .05, reject H0 for a two-tailed test but fail to reject for a one-tailed test c. With a = .05, fail to reject H0 for both a one-tailed and a two-tailed test d. With a = .05, reject H0 for both a one-tailed and a two-tailed testIf reserachers report from thier study were significant, P<.0.5 this means 1 we would expect the results to occur by less 5 times out of 100 2 if they conducted the study over they would get the same results less than 5 times in 100 3 the results are untrustworthy 4 we would expect the results to occur by chance less than 95 time out of 100
- Q1. An anthropologist wants to collect data to determine whether the two different cultural groups that occupy an isolated Pacific Island grow to be different heights. The results of his samples of the heights of adult females are as follows Do these samples constitute enough evidence to reject the null hypothesis that the heights of the two groups the same? Set alpha to .05.The designer of a new sheet metal stamping machine claims that their new machine can turn out a certain product faster than the machine now in use. Nine independent trials of stamping the same item on each machine gave the following results on times to completion:. Standard Machine: n1 = 9, x̄1 = 35.22 seconds, s1² = 24.4375 seconds² New Machine: n2 = 9, x̄2 = 31.56 seconds, s2² = 20.0275 seconds² Given the aforementioned data, the hypotheses H0: µ1 - µ2 ≤ 0 and H1: µ1 - µ2 > 0, α = 0.05, and assuming that the both machines have the same variance, is there evidence to substantiate the designer’s claim? a. The t test statistic equals 1.65, so there is sufficient evidence to substantiate the designer’s claim. b. The z test statistic equals 1.75, so there is insufficient evidence to substantiate the designer’s claim. c. The t test statistic equals 1.75, so there is sufficient evidence to substantiate the designer’s claim. d. The t test statistic…The designer of a new sheet metal stamping machine claims that their new machine can turn out a certain product faster than the machine now in use. Nine independent trials of stamping the same item on each machine gave the following results on times to completion:. Standard Machine: n1 = 9, x̄1 = 35.22 seconds, s1² = 24.4375 seconds² New Machine: n2 = 9, x̄2 = 31.56 seconds, s2² = 20.0275 seconds² Given the aforementioned data, the hypotheses H0: σ1² ≤ σ2² and H1: σ1² > σ2², and α = 0.05, is there evidence to conclude that σ1² ≤ σ2²? a. The test statistic equals 1.10, so there is evidence to conclude that σ1² ≤ σ2². b. The test statistic equals 0.91, so there is evidence to conclude that σ1² ≤ σ2². c. The test statistic equals 0.91, so there is not evidence to conclude that σ1² ≤ σ2². d. The test statistic equals 1.10, so there is not evidence to conclude that σ1² ≤ σ2². e. The test statistic equals 0.82, so there is not evidence to…
