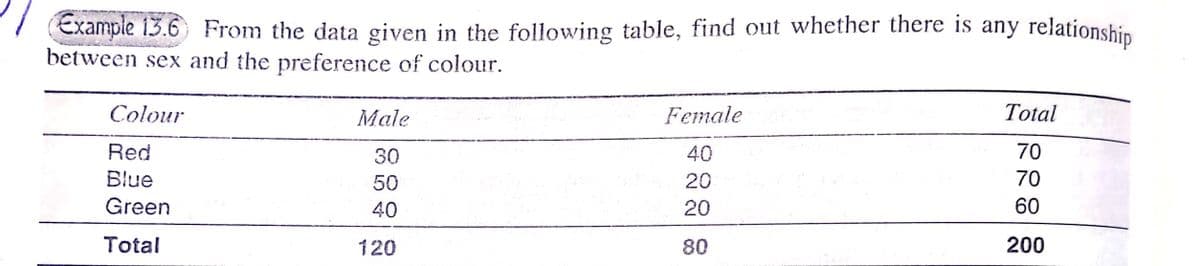
Example 13.6 From the data given in the following table, find out whether there is any relationship between sex and the preference of colour. Colour Total Male Female Red 70 30 40 Blue 70 50 20 Green 40 20 60 Total 200 120 80
Example 13.6 From the data given in the following table, find out whether there is any relationship between sex and the preference of colour. Colour Total Male Female Red 70 30 40 Blue 70 50 20 Green 40 20 60 Total 200 120 80

Glencoe Algebra 1, Student Edition, 9780079039897, 0079039898, 2018
18th Edition
ISBN:9780079039897
Author:Carter
Publisher:Carter
Chapter10: Statistics
Section10.6: Summarizing Categorical Data
Problem 4DGP

Related questions
Question
Transcribed Image Text:Example 13.6 From the data given in the following table, find out whether there is any relationship
between sex and the preference of colour.
Colour
Total
Male
Female
Red
70
30
40
Blue
70
50
20
Green
60
40
20
Total
200
120
80
Expert Solution
This question has been solved!
Explore an expertly crafted, step-by-step solution for a thorough understanding of key concepts.

Step by step
Solved in 2 steps

Recommended textbooks for you
Glencoe Algebra 1, Student Edition, 9780079039897…
Algebra
ISBN:
9780079039897
Author:
Carter
Publisher:
McGraw Hill
Glencoe Algebra 1, Student Edition, 9780079039897…
Algebra
ISBN:
9780079039897
Author:
Carter
Publisher:
McGraw Hill