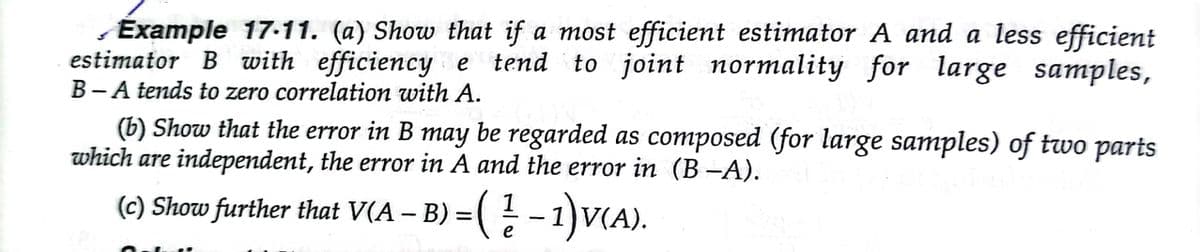
Example 17-11. (a) Show that if a most efficient estimator A and a less efficient estimator B with efficiency e B-A tends to zero correlation with A. tend to joint normality for large samples, (b) Show that the error in B may be regarded as composed (for large samples) of two parts which are independent, the error in A and the error in (B –A). (c) Show further that V(A – B) = (! -1)V(A).


Q: Using the Weight Scoring technique, provide the weight scores for each car option. Which car should ...
A: Answer: Total weighted score of car A= (0.3*3) + (0.5*6) + (0.2*4) = 0.9 + 3 + .8 = 4.7 Total ...
Q: 50. On average, 40 jobs arrive per day at a factory. Thetime between arrivals of jobs is exponential...
A: Given:
Q: From the clinical trial of an experimental growth factor drug, we got the following data, where D is...
A: 1 0.5 2 2.5 3 2 4 4 5 3.5 6 6 7 5.5 D = Dosage Unit ∆n = total unit of neutrophil The...
Q: You are given the values of sample means (X) and the range (R) for ten samples of size 5 each. Draw ...
A:
Q: 4. The quantity of Calcium level in the blood of a man follows a normal distribution with a standard...
A: Introduction: It is required to identify the confidence level, which suggests that the confidence in...
Q: The area head of GLOBE Broadband claims that more than 75 percent of his customers in Metro Manila...
A: Given that, The area head of GLOBE Broadband claims that more than 75 percent of his customers in ...
Q: Find the probability that a randomly chosen student a) studies music b) studies music or is female ...
A: Given : Spanish French Music Total males 23 12 26 61 Females 12 15 9 36 Total 35 ...
Q: his is for a biology paper I am interpreting my data) this question "Do the confidence intervals on...
A: Hypothesis testing plays a major role in research and development. To diagnose the underlying cause ...
Q: The time taken to complete a particular type of job is distributed approximately normal with a mean ...
A: Given that X~N( μ = 1.8 , ? = 0.1 ) μ = 1.8 , ? = 0.1 Z-score =(x-μ)/?
Q: Exercises 5: A corporation owns a chain of several hundred gasoline stations on the eastern seaboard...
A: Given data Station Before After 1 10500 12600 2 8870 10660 3 12300 11890 4 10510 14630 ...
Q: . If the coin is tossed 80 times, determine P(0.45 < p < 0.55). In solving this part, answer the fol...
A:
Q: The state of California has a mean annual rainfall of 22 inches, whereas the state of New York has a...
A: Given: For California: Mean,μ=22Std deviation,σ=4Sample size, n=30 For New York: Mean,μ=42Std deviat...
Q: Explain layout of LSD.
A:
Q: The absolute measure of association for a case-control study is the odds ratio. Justify your answer.
A: yes The absolute measure of association for a case-control study is the odds ratio. because odd rat...
Q: A random sample of size n1 =15 is selected from a normal population with a mean of 76 and standard ...
A: Introduction: Define X1, X2 as the random variables, denoting a randomly selected observation from t...
Q: The election un 8howed that a cortain candidate received 46%, of the votes. Determine the probebilit...
A: (a) Obtain the probability that a poll of 200 people selected at random from the voting population...
Q: 3) Ball bearing of agiven brand loeight oi50g with a standard de on of o.029.0hatis the probobility ...
A: Given that Let X1 and X2 denotes the mean weight of ball bearing in the two lots. Mean of lot one ...
Q: 12 Find out the value of A from the following data, and convert this value of Á into student t-value...
A:
Q: Format for the 3 blanks in parentheses (_, _, -) is (n, p, x-value). If you have a 83 or TI-84, Mood...
A: Given: n = 160 p = 0.09 X ~Bin(160, 0.09)
Q: nts to test that claim that, on average, her students average mark is 85. She pulls the records of 1...
A: Given: n = 100 μ=85σ=15x¯=75.40 It is two tailed test.
Q: Very likely Fairly likely Not too likely Not likely Reference the frequency distribution to create p...
A: Given that Response Frequency Very likely 487 Fairly likely 625 Not too likely 3456 ...
Q: Suppose X and Y have the following joint probabilities: p(1, 1) = 0.30 p(1,2) = 0.20 p(2, 1) = 0.10 ...
A:
Q: In a group of 76 tenth grade children, 34 answered item 25, cor- rectly and 38 answered item 29 corr...
A:
Q: For certain data the following regression equations were obtained: 4х — 5у + 33 % 0 20x + 9y - 107 =...
A: The two regression equations are given as: 4x -5y + 33 = 0 20x -9y -107 = 0
Q: The owner of an automobile repair shop studied the waiting times for customers who arrive at the sho...
A:
Q: If two balanced dice are rolled whats the probability that the sum of the two numbers will appear gr...
A: Given that : Two balanced die are rolled. We know that a die contains ( 1,2,3,4,5,6) Total outcome ...
Q: Q1: Two equal dice are rolled simultaneously. Let V represent the difference in the number of dots o...
A: Please note that as per our company's guidelines we can answer one question if multiple questions ar...
Q: 8. Given below is the information relating to marks in Statistics (X) and marks in Accountancy (Y) o...
A:
Q: Example 9-5. The mean yield for one-acre plot is 662 kilos with a s.d. 32 kilos. Assuming normal dis...
A:
Q: Explain uses of LSD.
A:
Q: 3. Someone claims that a one year increase in the average age of birth mothers is associated with an...
A: Given that Someone claims that a one year increase in the average age of birth mothers is associated...
Q: "The marks of the students in a certain examination are normally distributed with mean marks at 40% ...
A:
Q: - P(X 1) = - P(2 1) =
A:
Q: Éxample 17-11. (a) Show that if a most efficient estimator A and a less efficient estimator B with e...
A:
Q: Use the standard normal table to find the following probability. Enter your answer as a proportion (...
A:
Q: (a) Find the mean and standard deviation of the first n natural numbers. (b) Hence deduce the mean a...
A:
Q: Find the missing information in the following table : R
A: It is given that Number of observations in A = NA = 10 Number of observations in B = NB = 8 Number o...
Q: ing Fisher's Ideal Formula: • From the data given below construct index number of the group of four ...
A:
Q: 10. 1.1 1.9 2.4 4.1 4.6 6. 8.1 8.3 9.1 9.8 y 10 25 41 261 439 2,041 18,271 22,130 | 56,151 119,550 I...
A: Given data: x y 1.1 10 1.9 25 2.4 41 4.1 261 4.6 439 6 2041 8.1 18271 8.3 22130 ...
Q: 3. A delivery truck travels from point A to point B and back using the same route each day. There ar...
A: Given, X/Y 0 1 2 3 4 0 0.01 0.01 0.03 0.07 0.01 1 0.03 0.05 0.08 0.03 0.02 2 0.03 0.11 0....
Q: SAT scores are distributed with a mean of 1,500 and a standard deviation of 300. You are interested ...
A:
Q: A geological study indicates that an exploratory oil well should strike oil with probability .2. a W...
A: Here given geological study indicate that an exploratory oil well should strike oil with probability...
Q: Finance Majors Business Analytics Majors n= 140 n2 = 30 X, = $48,137 X2 = $55,217 s, = $19,000 S2 = ...
A: We have given that Sample sizes n1= 140 , n2= 30 Sample means X̄1=48137 , X̄2=55217 ...
Q: 9) A control system will be constructed according to the following requirement: The height of the co...
A:
Q: A student in the team suggested the following sampling procedure: “We target to interview 40 student...
A: b) The name of this sampling method used in this experiment is Random Sampling Technique. c) The fix...
Q: A. Accept Ho B. Reject Ho C. Fail to reject Ho D. Accept H, E. Reject H, F. Fail to reject Hạ
A:
Q: Given that E p,9, = 250, E poqo = 150, Paasche's index number = 150 and Dorbish-Bowley's index numbe...
A: Dorbish-bowley's index number is given by, P01D = (P01L+P01P)/2 Where P01L is laspyre's index numb...
Q: A die is thrown at random. What is the expectation of the mumber on it ? 5 1 2 3 4 6 1:6 116 1/6 1/6...
A:
Q: a. In words, define the Random Variable X. b. List the values that X may take on. (List every single...
A: Here AS PER POLICY I HAVE CALCULATED 3 SUBPARTS PLZ REPOST FOR REMAINING PARTS HERE given, A schoo...
Q: 150, Paasche's index number = 150 and Dorbish-Bowley's index Given that E pig, = 250, E Poqo number ...
A:

Step by step
Solved in 2 steps with 2 images

- Olympic Pole Vault The graph in Figure 7 indicates that in recent years the winning Olympic men’s pole vault height has fallen below the value predicted by the regression line in Example 2. This might have occurred because when the pole vault was a new event there was much room for improvement in vaulters’ performances, whereas now even the best training can produce only incremental advances. Let’s see whether concentrating on more recent results gives a better predictor of future records. (a) Use the data in Table 2 (page 176) to complete the table of winning pole vault heights shown in the margin. (Note that we are using x=0 to correspond to the year 1972, where this restricted data set begins.) (b) Find the regression line for the data in part ‚(a). (c) Plot the data and the regression line on the same axes. Does the regression line seem to provide a good model for the data? (d) What does the regression line predict as the winning pole vault height for the 2012 Olympics? Compare this predicted value to the actual 2012 winning height of 5.97 m, as described on page 177. Has this new regression line provided a better prediction than the line in Example 2?Suppose that the index model for two Canadian stocks HD and ML is estimated with the following results: RHD =-0.03+2.10RM+eHD R-squared =0.7 RML =0.06+1.60RM+eML R-squared =0.6 σM =0.15 where M is S&P/TSX Comp Index and RX is the excess return of stock X. What is the covariance and the correlation coefficient between HD and ML?ch 11. 4 Oxnard Petro, Ltd., has three interdisciplinary project development teams that function on an ongoing basis. Team members rotate from time to time. Every 4 months (three times a year) each department head rates the performance of each project team (using a 0 to 100 scale, where 100 is the best rating). Are the main effects significant? Is there an interaction?
- Suppose that the index model for two Canadian stocks HD and ML is estimated with the following results: RHD =-0.03+2.10RM+eHD R-squared =0.7 RML =0.06+1.60RM+eML R-squared =0.6 σM =0.15 where M is S&P/TSX Comp Index and RX is the excess return of stock X. What is the covariance and the correlation coefficient between HD and ML? For portfolio P with investment proportion of 0.4 in HD and 0.6 in ML, calculate the systematic risk, non-systematic risk, and total risk of P.Suppose that index model for Stocks A and B is estimated from excess returns with the following results : Ra 0.04 +0.6Rm+ea , Rb = - 0.04 + 1.3Rm + eb Risk on the market is 30% , R-squared of A is 30%R - squared of B is 40% , security A residual variance isA possible important environmental determinant of lung function in children is the amount of cigarette smoking in the home. Suppose this question is studied by selecting two groups: Group 1 consists of 23 nonsmoking children 5-9 years of age, both of whose parents smoke, who have a mean forced expiratory volume (FEV) of 2.1 L and a standard deviation of 0.7 L; group 2 consists of 20 nonsmoking children of comparable age, neither of whose parents smoke, who have a mean FEV of 2.3 L and a standard deviation of 0.4 L.*8.31 What are the appropriate null and alternative hypotheses to compare the means of the two groups? *8.32 What is the appropriate test procedure for the hypotheses in Problem 8.31? *8.33 Carry out the test in Problem 8.32 using the criticalvalue method. *8.34 Provide a 95% CI for the true mean difference in FEV between 5- to 9-year-old children whose parents smoke and comparable children whose parents do not smoke. *8.35 Assuming this is regarded as a pilot study, how many…
- Note- bolded quiz have already answered A possible important environmental determinant of lung function in children is the amount of cigarette smoking in the home. Suppose this question is studied by selecting two groups: Group 1 consists of 23 nonsmoking children 5-9 years of age, both of whose parents smoke, who have a mean forced expiratory volume (FEV) of 2.1 L and a standard deviation of 0.7 L; group 2 consists of 20 nonsmoking children of comparable age, neither of whose parents smoke, who have a mean FEV of 2.3 L and a standard deviation of 0.4 L.*8.31 What are the appropriate null and alternative hypotheses to compare the means of the two groups? *8.32 What is the appropriate test procedure for the hypotheses in Problem 8.31? *8.33 Carry out the test in Problem 8.32 using the criticalvalue method. *8.34 Provide a 95% CI for the true mean difference in FEV between 5- to 9-year-old children whose parents smoke and comparable children whose parents do not smoke. *8.35 Assuming…If a sample of 25 pairs of data yields a correlation coefficient, r, of 0.390 and the scatterplot displays a linear trend, can you use the regression equation to make predictions, assuming your x-values are within the domain of the data set? Choose your answer from the multiple choice answers below A.) Yes, because rcrit = 0.396 and the regression coefficient, r, is less than this value. B.) Yes, because rcrit = 0.381 and the regression coefficient, r, is greater than this value. C.) No, because rcrit = 0.381 and the regression coefficient, r, is greater than this value. D.) No, because rcrit = 0.396 and the regression coefficient, r, is less than this value.Which of the following is NOT a good reason for including a disturbance term in a regression equation? Select one: a. It captures omitted determinants of the dependent variable b. To allow for errors in the measurement of the dependent variable c. To allow for random influences on the dependent variable d. To allow for the non-zero mean of the dependent variable
- QUESTION 12 Historically, the proportion of people who trade in their old car to a car dealer when purchasing a new car is 48%. Over the previous 6 months, in a sample of 115 new-car buyers, 46 have traded in their old car. To determine (at the 10% level of significance) whether the proportion of new-car buyers that trade in their old car has statistically significantly decreased, what can you conclude concerning the null hypothesis? Reject the null hypothesis Fail to reject the null hypothesisFor some genetic mutations, it is thought that the frequency of the mutant gene in men increases linearly with age. If m1 is the frequency at age t1, and m2 is the frequency at age t2, then the yearly rate of increase is estimated by r = (m2 − m1)/(t2 − t1). In a polymerase chain reaction assay, the frequency in 20-year-old men was estimated to be 17.7 ± 1.7 per μgDNA, and the frequency in 40-year-old men was estimated to be 35.9 ± 5.8 per μg DNA. Assume that age is measured with negligible uncertainty.a) Estimate the yearly rate of increase, and find the uncertainty in the estimate.b) Find the relative uncertainty in the estimated rate of increase.Question 2: Assume that the risk-free rate, RF, is currently 8%, the market return, RM, is 12%, and asset A has a beta, of 1.10. (could be done on word document or excel). Assume that as a result of recent events, investors have become more risk averse, causing the market return to rise by 2%, to be14%. Ignoring the shift in part c, draw the new SML on the same set of axes that you used before, and calculate and show the new required return for asset A. From the previous changes, what conclusions can be drawn about the impact of (1) decreased inflationary expectations and (2) increased risk aversion on the required returns of risky assets?