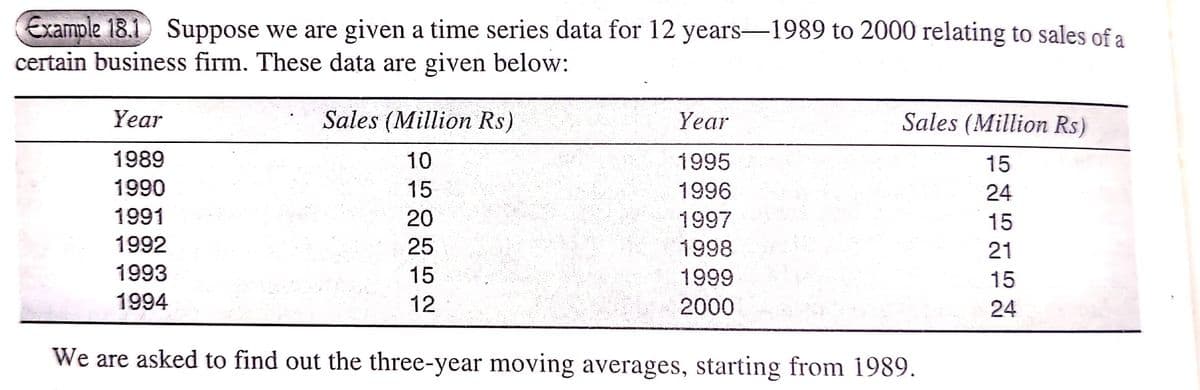
Example 18.1 Suppose we are given a time series data for 12 years-1989 to 2000 relating to sales of a certain business firm. These data are given below: Year Sales (Million Rs) Year Sales (Million Rs) 1989 10 1995 15 1990 15 1996 24 1991 20 1997 15 1992 25 1998 21 1993 15 1999 15 1994 12 2000 24 We are asked to find out the three-year moving averages, starting from 1989.
Q: 8.S.2 Refer to Exercise 8.S.1 0. Compare the before and after populations using a t test at a =…
A: T test are used to test whether there is mean significance exist between the sample and population.…
Q: Ball-Bearings, Inc. produces ball bearings automatically on a Kronar BBX machine. For one of the…
A: It is given that the mean is 20 and the standard deviation is 0.150.
Q: In pharmacologic research a variety of clinical chemistry measurements are routinely monitored…
A: "Since you have posted a question with multiple subparts, we will solve first 3 sub-parts for you.…
Q: This question asks you to extend the medical-test example from class. Suppose there is a medical…
A:
Q: 78.1
A: By applying the 't-test Given, population mean (μ) = 52.1
Q: Scores on a certain "IQ" test for 18-25 year olds are normally distributed. A researcher believes…
A: Solution:- from given information Null hypothesis H0:μ=110Alternate hypothesis Ha:μ<110mean…
Q: (b) What sample size would be required for the width of a 99% CI to be at most 0.03 irrespective of…
A: The confidence level is 99% Therefore, α = 0.01 and α/2=0.005. The margin of error is 0.03. Since…
Q: Aldosterone is a hormone involved in maintaining fluid balance in the body. In a veterinary study,…
A:
Q: Sam is a competitive swimmer that competes in the 100 m freestyle and 100 m backstroke. High school…
A: For a specified type of swim, the z-score for Sam time may be defined as the standardized difference…
Q: The table below shows the enrollments for the four division of a college. There are 50 new overhead…
A:
Q: Use the sample data and confidence level given below to complete parts (a) through (d). A drug is…
A:
Q: ume that when adults with smartphones are randomly selected, 41% use them in meetings or classes. If…
A:
Q: Which of the following is the slope of the regression line for your data on the number server users…
A: From the above data
Q: d) Using this portion of the standard normal chart and part (c), find the probability P(x 2 60). .00…
A: Binomial probability formula: P(X = x) = nCx*px*(1-p)n-x
Q: 13. In a basketball free-throw competition, a player shoots until he or she misses a basket. Can…
A: HERE use basic of binomial distribution
Q: X is a normally distributed random variable with mean, µ but unknown variance, o Which of these…
A: From the provided information, X is normally distributed with mean µ and unknown σ2. Sample size is…
Q: During the 2010 MLB seasons, the home team won 1,269 games and the away team won 1,371 games. What…
A:
Q: You intend to conduct a goodness-of-fit test for a multinomial distribution with 3 categories. You…
A: Given that You intend to conduct a goodness-of-fit test for a multinomial distribution with 3…
Q: Which of the following predictions can be calculated using a binomial distribution? a. whether a…
A: Ans - Which of the following predictions can be calculated using a binomial distribution?
Q: Draw a tree diagram for Type B seed, giving the probabilities for each branch. ii) Calculate the…
A: here define events good rainfall = R type B seed growing = G
Q: Mary has an assignment to ask at random 30 students in their school about their grades in…
A: Given data is Grades Frequency 95-99 9 90-94 6 85-89 9 80-84 3 75-79 3
Q: What is the expected cell count for students who find SAS difficult to learn and who are not…
A: The total number of students who find SAS difficult is 28.
Q: How many hours of sleep do people get by listening to music? I record 10 subjects’ hours of sleep…
A:
Q: The test statistic of z=1.50 is obtained when testing the claim that p≠0.427. Identify the…
A: GivenTest statistic(z)=1.50claim is p≠0.427
Q: (a) Before Covid the QTI Summer Examinations were invigilated, closed-book exams. The scores on the…
A: From the provided information, it is interpreted that: n (sample size)=35x¯ (sample mean)=5σ (true…
Q: A fitness trainer is interested in investigating whether ethnicity and the first exercise activity…
A: Solution-: Given: α=0.01 We have given the following table: Cardio Weight Machines Free…
Q: Two samples are taken with the following numbers of successes and sample sizes r1 = 25 r2 = 40 n1 =…
A: Given data,r1=25n1=72p1=r1n1=2572=0.347r2=40n2=78p2=r2n2=4078=0.513Construct a 92% CI?
Q: Example 13.12 The divisional manager of a retail chain believes the average number of customers…
A:
Q: Q19. The diagram below shows a scatter diagram of values of the variables x and y. Which one of the…
A: Given diagram is a Scatter plot. We can see that as x is increasing, y is also increasing. So there…
Q: Given data is 157, 149, 162, 168, 155, 155, 157.48, 165, 157, 157 sample size (n)=10 sample mean =…
A: Given Sample sizen=10 Sample mean=158.2480 Sample variance=29.6284 Sample standard deviation=5.4432…
Q: R is a Normally distributed Random Variable such that r~ N(10,4). Which of the following is equal to…
A:
Q: An article in Journal of Food Science (2001, Vol. 66, No. 3, pp. 472-477) studied potato spoilage…
A:
Q: 20. Below is an actual bar graph displayed on CNN during the Terri Schiavo controversy. The graph…
A:
Q: You are a vendor selling programs in front of the stadium of a certain pro football team that has…
A:
Q: Part 5 Suppose that the observed value of permeability at x = 3.7 is y = 46.1. Calculate the value…
A: It is given: n=14∑yi=572, ∑yi2=23530∑xi=43, ∑xi2=157.42∑xiyi=1697.80
Q: ACTIVITY. The following are the grades of 7 learners in Filipino and English. Compute the…
A: Given information: step 1: X Y 90 89 88 88 88 90 96 94 92 94 91 90 99 99 step…
Q: Decide which of the following statements are true. A.Normal distributions are symmetric, but they…
A: Answer - Decide which of the following statements are true.
Q: Determine whether each of the following experiments/situations involve a discrete or a continuous…
A: A discrete random variable: Its value is obtained by counting. A continuous random variable: Its…
Q: This question asks you to extend the medical-test example from class. Suppose there is a medical…
A:
Q: (a) Determine the sample space of the experiment. That is, list all possible simple random samples…
A: HERE use given information and basic probability and sample space
Q: What is the EXPECTED COUNT for the cell that has 36 in it (Positive and High)? The answer is an…
A: here given contingency table high intensity low intensity total positive recognition 36 9…
Q: A particular fruit's weights are normally distributed, with a mean of 422 grams and a standard…
A: It is given that the mean is 422 and the standard deviation is 10.
Q: The median mass of a collection of 8 oranges, some of which have the same mass, is 200 g. If a ninth…
A:
Q: Which of the following distribution belongs to continuous distribution? A.The temperature at which…
A: Which of the following distribution belongs to continuous distribution?
Q: o Involve collecting and organizing data o Involve analyzing the data o Allow the use of technology,…
A: Objective: To come up with a question that will involve collecting, organizing, analysing and…
Q: If the observations in a treatment from a single-factor experiment are 10, 12, 8, 14, and 6, the…
A: For the given data Select the correct choice
Q: An engineer wants to determine how the weight of a car, x, affects gas mileage, y. The following…
A: Given the data of weight of car x and mileage of car y as shown below in excel
Q: Question 9 A Generalised Extreme Value distribution with parameters below has been selected for…
A:
Q: :μ1=μ2Ho Ha:μ1>μ2 You obtain the following two samples of data. Sample #1 Sample #2 84.3…
A: For sample 1 : sample size (n1) = 55sample mean (x̄1) = 76.53sample standard deviation (s1) =…
Q: It has been found that 1 out of every four South African drivers has at least one outstanding…
A: The probability that a randomly selected South African driver has at least one outstanding parking…
Step by step
Solved in 2 steps with 2 images
- QUESTION 13 Suppose that historically, the proportion of people who trade in their old car to a car dealer when purchasing a new car is 48%. Over the previous 6 months, in a sample of 115 new-car buyers, 46 have traded in their old car. To determine whether the proportion of new car buyers that trade in their old car has statistically significantly decreased, what is the p-value? (please round your answer to 4 decimal places)QUESTION 27 Suppose the following are the seasonal indices for the first three quarters of the year for a quarterly series: Quarter Seasonal Index Q1 73.7 Q2 85 Q3 105.7 Remember that the seasonal indices should average 100 so you should be able to infer the seasonal index for Q4. Furthermore, suppose that the estimated coeffcients from a regression of the deseasonalized series on Time are given below: Coefficients Intercept 2,857 Time 59.1 What is the trend projection of the series for period 112? (please round your answer to 1 decimal place)question 2 Suppose the following are the seasonal indices for the first three quarters of the year for a quarterly series: Quarter Seasonal Index Q1 70 Q2 134.5 Q3 115 Remember that the seasonal indices should average 100 so you should be able to infer the seasonal index for Q4. Furthermore, suppose that the estimated coeffcients from a regression of the deseasonalized series on Time are given below: Coefficients Intercept 2,484 Time 73.2 In general, what quarter is the busiest time of the year? (please just answer 1, 2, 3, or 4)
- QUESTION 28 Suppose the following are the seasonal indices for the first three quarters of the year for a quarterly series: Quarter Seasonal Index Q1 72.2 Q2 87.1 Q3 106 Remember that the seasonal indices should average 100 so you should be able to infer the seasonal index for Q4. Furthermore, suppose that the estimated coeffcients from a regression of the deseasonalized series on Time are given below: Coefficients Intercept 1,993 Time 75.3 What is the forecast for period 62, if period 62 is a Q1? (please round your answer to 1 decimal place)The following data set provides the total number of shipments of core major household appliances in the U.S. from 2000 to 2016 (in millions): Year Shipments (millions) 2000 38.4 2001 38.2 2002 40.8 2003 42.5 2004 46.1 2005 47.0 2006 46.7 2007 44.1 2008 39.8 2009 36.5 2010 38.2 2011 36.0 2012 35.8 2013 39.2 2014 41.5 2015 42.9 2016 44.7 a. Plot the time series. b. Fit a three-year moving average to the data and plot the results. c. Fit a five-year moving average to the data and plot the results. d. Compute a linear trend forecasting equation and plot the trend line. e. Compute a quadratic trend forecasting equation and plot the results.Question 17 Suppose Carole has a total wealth of $100,000 and a utility described by U = E -A She has a risk aversion coefficient of A-1. She can borrow and lend/invest at the risk-free rate of 2.8%. Suppose the optimal risky portfolio has an expected return of 12% and a standard deviation of 27.5%, What is her optimal amount to borrow or lend/invest at the risk free rate? Indicate investing/lending as a positive number and borrowing as a negative number. Round to the nearest cent ($0.01). Your answer should not include the $ sign. If your answer is $25.34, it should be written as 25.34. Question 18 Ayear ago, an investor bought 200 shares of a "no-load" mutual fund at $10.01 per share. No-load funds do not change "entry fees or "exit" fees when buying or redeeming shares. Sometime during the year, the fund paid dividends of $0.71 per share and the fund paid capital gains of $0.14 per share - and these payments were reinvested in the fund at an average price of $10.73 per share…
- consider the following time series data.t 1 2 3 4 5 6 7yt10 9 7 8 6 4 4a. construct a time series plot. What type of pattern exists in the data?b. develop the linear trend equation for this time series.c. What is the forecast for t = 8?Consider the following time series data. Week 1 2 3 4 5 6 Value 18 13 16 11 17 14 Construct a time series plot. What type of pattern exist in the data? Develop a three-week moving average for this time series. Compute MSE and forecast for week 7. Use a = 0.2 to compute the exponential smoothing values for the time series. Compute MSE and forecast for week 7.Consider the following time series data Month 1 2 3 4 5 6 7 8 9 10 11 12 Value 80 82 84 83 83 84 85 84 82 83 84 83 a) Construct a time series plot in Excel. Label the axes and graph. b) Develop a three month moving average forecast. Compute MSE and a forecast for month 13. c) Develop an exponential smoothing forecast with a = 0.35. Compute MSE and a forecast for month 13.
- Consider the following time series data. Week 1 2 3 4 5 6 Value 19 14 17 12 18 15 (a) Construct a time series plot. A time series plot contains a series of 6 points connected by line segments. The horizontal axis ranges from 0 to 7 and is labeled: Week. The vertical axis ranges from 0 to 20 and is labeled: Time Series Value. The points are plotted from left to right in regular increments of 1 week starting at week 1. The points appear to vary randomly between 10 to 17 on the vertical axis. The plot reaches its maximum time series value at week 6. A time series plot contains a series of 6 points connected by line segments. The horizontal axis ranges from 0 to 7 and is labeled: Week. The vertical axis ranges from 0 to 20 and is labeled: Time Series Value. The points are plotted from left to right in regular increments of 1 week starting at week 1. The points appear to vary randomly between 12 to 19 on the vertical axis. The plot reaches its maximum time series value at…Consider the following time series data. Week 1 2 3 4 5 6 Value 19 14 17 12 18 15 (a) Construct a time series plot. A time series plot contains a series of 6 points connected by line segments. The horizontal axis ranges from 0 to 7 and is labeled: Week. The vertical axis ranges from 0 to 20 and is labeled: Time Series Value. The points are plotted from left to right in regular increments of 1 week starting at week 1. The points appear to vary randomly between 10 to 17 on the vertical axis. The plot reaches its maximum time series value at week 6. A time series plot contains a series of 6 points connected by line segments. The horizontal axis ranges from 0 to 7 and is labeled: Week. The vertical axis ranges from 0 to 20 and is labeled: Time Series Value. The points are plotted from left to right in regular increments of 1 week starting at week 1. The points appear to vary randomly between 12 to 19 on the vertical axis. The plot reaches its maximum time series value at…consider the following time series data.Month 1 2 3 4 5 6 7Value 24 13 20 12 19 23 15a. compute MSe using the most recent value as the forecast for the next period. Whatis the forecast for month 8?b. compute MSe using the average of all the data available as the forecast for the nextperiod. What is the forecast for month 8?c. Which method appears to provide the better forecast?