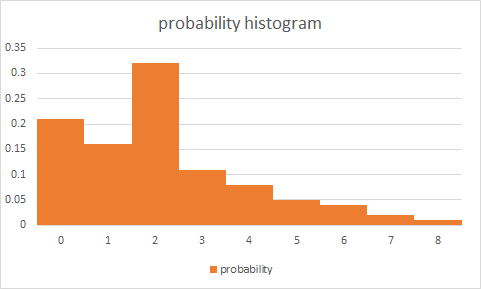
Example 3: Alexis is selling girl scout cookies. She has kept track of the number of boxes of cookies that her customers have purchased over the last 2 years. She wants to use this data to help predict how many boxes of cookies a new customer might purchase. The table below summarizes Alexis' data, with the number of boxes that a customer might purchase along with the corresponding probability that they will purchase that number of boxes based on her previous sales. Use this information to answer the following questions. Outcomes: 1 4 6. 7 8 X xi Probability: P(X = x1) 0.21 0.16 0.32 0.11 0.08 0.05 0.04 0.02 0.01 a) Construct a probability histogram of the data in the table above and comment on the shape.


Contingency Table
A contingency table can be defined as the visual representation of the relationship between two or more categorical variables that can be evaluated and registered. It is a categorical version of the scatterplot, which is used to investigate the linear relationship between two variables. A contingency table is indeed a type of frequency distribution table that displays two variables at the same time.
Binomial Distribution
Binomial is an algebraic expression of the sum or the difference of two terms. Before knowing about binomial distribution, we must know about the binomial theorem.
a)
b)what is the probability that a randomly selected customer will purchase 3 boxes of cookies
from table x =3
p(x) = 0.11

Trending now
This is a popular solution!

Step by step
Solved in 2 steps with 1 images


