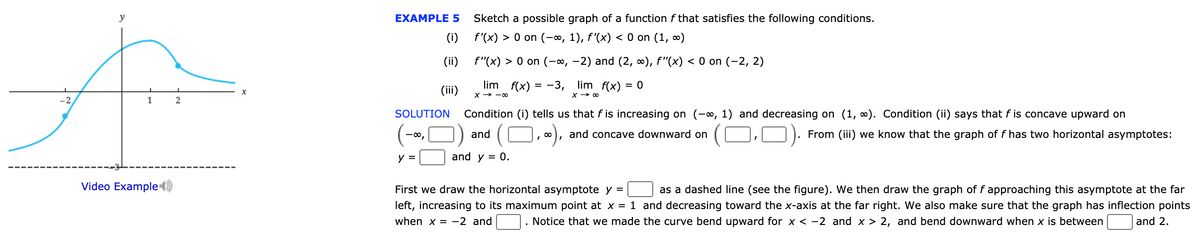
EXAMPLE 5 Sketch a possible graph of a function f that satisfies the following conditions. (1) r(x) > 0 on (-», 1), f'(x) < 0 on (1, ) (ii) f"(x) > 0 on (-», -2) and (2, ), f"(x) < 0 on (-2, 2) (iii) lim f(x) = -3, lim f(x) = 0
EXAMPLE 5 Sketch a possible graph of a function f that satisfies the following conditions. (1) r(x) > 0 on (-», 1), f'(x) < 0 on (1, ) (ii) f"(x) > 0 on (-», -2) and (2, ), f"(x) < 0 on (-2, 2) (iii) lim f(x) = -3, lim f(x) = 0

Functions and Change: A Modeling Approach to College Algebra (MindTap Course List)
6th Edition
ISBN:9781337111348
Author:Bruce Crauder, Benny Evans, Alan Noell
Publisher:Bruce Crauder, Benny Evans, Alan Noell
Chapter5: A Survey Of Other Common Functions
Section5.6: Higher-degree Polynomials And Rational Functions
Problem 14E

Related questions

Question
Transcribed Image Text:y
EXAMPLE 5
Sketch a possible graph of a function f that satisfies the following conditions.
(i)
f'(x) > 0 on (-∞, 1), f'(x) < 0 on (1, o)
(ii)
f"(x) > 0 on (-∞, -2) and (2, 0), f"(x) < 0 on (-2, 2)
(ii)
lim f(x) = -3, lim f(x) =
X → 00
X> -00
1
2
SOLUTION
Condition (i) tells us that f is increasing on (-o, 1) and decreasing on (1, o). Condition (ii) says that f is concave upward on
-00,
and
and concave downward on
From (iii) we know that the graph of f has two horizontal asymptotes:
00
y =
and y = 0.
Video Example
First we draw the horizontal asymptote y =
as a dashed line (see the figure). We then draw the graph of f approaching this asymptote at the far
left, increasing to its maximum point at x = 1 and decreasing toward the x-axis at the far right. We also make sure that the graph has inflection points
Notice that we made the curve bend upward for x < -2 and x > 2, and bend downward when x is between
when x = -2 and
and 2.
Expert Solution
This question has been solved!
Explore an expertly crafted, step-by-step solution for a thorough understanding of key concepts.

This is a popular solution!

Trending now
This is a popular solution!

Step by step
Solved in 2 steps with 1 images

Knowledge Booster


Learn more about
Need a deep-dive on the concept behind this application? Look no further. Learn more about this topic, calculus and related others by exploring similar questions and additional content below.Recommended textbooks for you
Functions and Change: A Modeling Approach to Coll…
Algebra
ISBN:
9781337111348
Author:
Bruce Crauder, Benny Evans, Alan Noell
Publisher:
Cengage Learning

Glencoe Algebra 1, Student Edition, 9780079039897…
Algebra
ISBN:
9780079039897
Author:
Carter
Publisher:
McGraw Hill

Algebra & Trigonometry with Analytic Geometry
Algebra
ISBN:
9781133382119
Author:
Swokowski
Publisher:
Cengage
Functions and Change: A Modeling Approach to Coll…
Algebra
ISBN:
9781337111348
Author:
Bruce Crauder, Benny Evans, Alan Noell
Publisher:
Cengage Learning
Glencoe Algebra 1, Student Edition, 9780079039897…
Algebra
ISBN:
9780079039897
Author:
Carter
Publisher:
McGraw Hill
Algebra & Trigonometry with Analytic Geometry
Algebra
ISBN:
9781133382119
Author:
Swokowski
Publisher:
Cengage