Example: Put all the letters of the alphabet in a hat. If you choose a consonant, I pay you $1. If you choose a vowel, I pay you $5. X is the random variable representing the outcome of the experiment. Create the distribution of X.
Example: Put all the letters of the alphabet in a hat. If you choose a consonant, I pay you $1. If you choose a vowel, I pay you $5. X is the random variable representing the outcome of the experiment. Create the distribution of X.

College Algebra
7th Edition
ISBN:9781305115545
Author:James Stewart, Lothar Redlin, Saleem Watson
Publisher:James Stewart, Lothar Redlin, Saleem Watson
Chapter9: Counting And Probability
Section: Chapter Questions
Problem 2P: Family Planning A intend to have two children. What is tie probability that they will have child of...

Related questions
Question
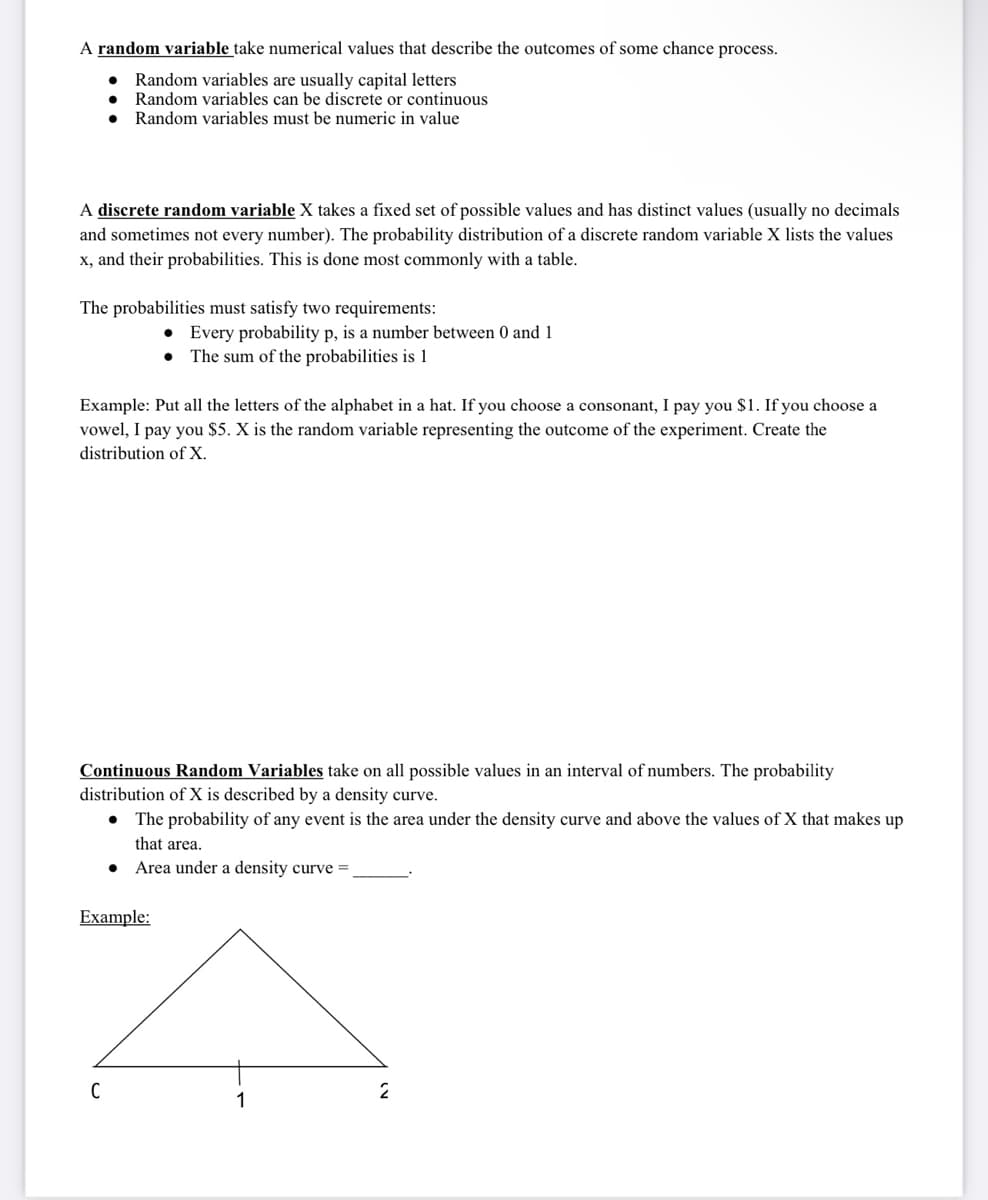
Transcribed Image Text:A random variable take numerical values that describe the outcomes of some chance process.
Random variables are usually capital letters
Random variables can be discrete or continuous
Random variables must be numeric in value
A discrete random variable X takes a fixed set of possible values and has distinct values (usually no decimals
and sometimes not every number). The probability distribution of a discrete random variable X lists the values
x, and their probabilities. This is done most commonly with a table.
The probabilities must satisfy two requirements:
Every probability p, is a number between 0 and 1
The sum of the probabilities is 1
Example: Put all the letters of the alphabet in a hat. If you choose a consonant, I pay you $1. If you choose a
vowel, I pay you $5. X is the random variable representing the outcome of the experiment. Create the
distribution ofX.
Continuous Random Variables take on all possible values in an interval of numbers. The probability
distribution of X is described by a density curve.
The probability of any event is the area under the density curve and above the values of X that makes up
that area.
• Area under a density curve =
Example:
C
2
1
Expert Solution
This question has been solved!
Explore an expertly crafted, step-by-step solution for a thorough understanding of key concepts.

This is a popular solution!

Trending now
This is a popular solution!

Step by step
Solved in 3 steps with 1 images

Recommended textbooks for you
College Algebra
Algebra
ISBN:
9781305115545
Author:
James Stewart, Lothar Redlin, Saleem Watson
Publisher:
Cengage Learning

Algebra and Trigonometry (MindTap Course List)
Algebra
ISBN:
9781305071742
Author:
James Stewart, Lothar Redlin, Saleem Watson
Publisher:
Cengage Learning

College Algebra
Algebra
ISBN:
9781305115545
Author:
James Stewart, Lothar Redlin, Saleem Watson
Publisher:
Cengage Learning
Algebra and Trigonometry (MindTap Course List)
Algebra
ISBN:
9781305071742
Author:
James Stewart, Lothar Redlin, Saleem Watson
Publisher:
Cengage Learning


Algebra & Trigonometry with Analytic Geometry
Algebra
ISBN:
9781133382119
Author:
Swokowski
Publisher:
Cengage