Part 2 Answer the following to summarize the test of the hypothesis that the distribution of highest degrees earned by Thinking Channel viewers is the same as the distribution of highest degrees earned by American adults as a whole. Use the 0.05 level of significance for the test. (a) Determine the type of test statistic to use. Type of test statistic: (Choose one) 2+, Chi-square, or F? (b) Find the value of the test statistic. (Round your answer to two or more decimal places.) ☐ (c) Find the p-value. (Round your answer to three or more decimal places.) (d) Can we conclude that the distribution of highest degrees earned by Thinking Channel viewers is different from the distribution of highest degrees earned by American adults as a whole? O Yes No Executives at The Thinking Channel have decided to test whether the educational backgrounds of the channel's viewers are different from the educational backgrounds of American adults (ages 25 and over) as a whole. The executives have the following information on the American adult ? population as a whole, obtained from a recent U.S. Current Population Survey. College Highest degree earned Less than high school High school Percent of population 12% 25% 55% Higher than college 8% 00 ☑ The executives also obtained data (from telephone surveys) on highest degrees earned for a random sample of 180 American adults who are Thinking Channel viewers. These data are summarized by the first row of numbers in the table below. These numbers are the frequencies for the degree categories that were observed in the sample of 180. The second row of numbers gives the expected frequencies under the assumption that the distribution of highest degrees earned by Thinking Channel viewers is the same as the distribution of highest degrees earned by American adults as a whole. The bottom row of numbers gives the following value for each of the degree categories. (fo-ƒE)² SE (Observed frequency - Expected frequency)² Expected frequency Part 1 Fill in the missing values in the table. Round your responses for the expected frequencies to two or more decimal places. Round your (So-SE) responses to three or more decimal places. SE Send data to Excel Observed frequency fo Expected frequency SE (So-fE)² JE Less than high school High school College Higher than college Total 16 38 110 16 180 ☐ 99.00 14.40 ☐ 1.222 0.178
Part 2 Answer the following to summarize the test of the hypothesis that the distribution of highest degrees earned by Thinking Channel viewers is the same as the distribution of highest degrees earned by American adults as a whole. Use the 0.05 level of significance for the test. (a) Determine the type of test statistic to use. Type of test statistic: (Choose one) 2+, Chi-square, or F? (b) Find the value of the test statistic. (Round your answer to two or more decimal places.) ☐ (c) Find the p-value. (Round your answer to three or more decimal places.) (d) Can we conclude that the distribution of highest degrees earned by Thinking Channel viewers is different from the distribution of highest degrees earned by American adults as a whole? O Yes No Executives at The Thinking Channel have decided to test whether the educational backgrounds of the channel's viewers are different from the educational backgrounds of American adults (ages 25 and over) as a whole. The executives have the following information on the American adult ? population as a whole, obtained from a recent U.S. Current Population Survey. College Highest degree earned Less than high school High school Percent of population 12% 25% 55% Higher than college 8% 00 ☑ The executives also obtained data (from telephone surveys) on highest degrees earned for a random sample of 180 American adults who are Thinking Channel viewers. These data are summarized by the first row of numbers in the table below. These numbers are the frequencies for the degree categories that were observed in the sample of 180. The second row of numbers gives the expected frequencies under the assumption that the distribution of highest degrees earned by Thinking Channel viewers is the same as the distribution of highest degrees earned by American adults as a whole. The bottom row of numbers gives the following value for each of the degree categories. (fo-ƒE)² SE (Observed frequency - Expected frequency)² Expected frequency Part 1 Fill in the missing values in the table. Round your responses for the expected frequencies to two or more decimal places. Round your (So-SE) responses to three or more decimal places. SE Send data to Excel Observed frequency fo Expected frequency SE (So-fE)² JE Less than high school High school College Higher than college Total 16 38 110 16 180 ☐ 99.00 14.40 ☐ 1.222 0.178

Glencoe Algebra 1, Student Edition, 9780079039897, 0079039898, 2018
18th Edition
ISBN:9780079039897
Author:Carter
Publisher:Carter
Chapter4: Equations Of Linear Functions
Section: Chapter Questions
Problem 8SGR

Related questions
Question
Help please. I am extremely confused and do not understand this! Can I get help with all parts please
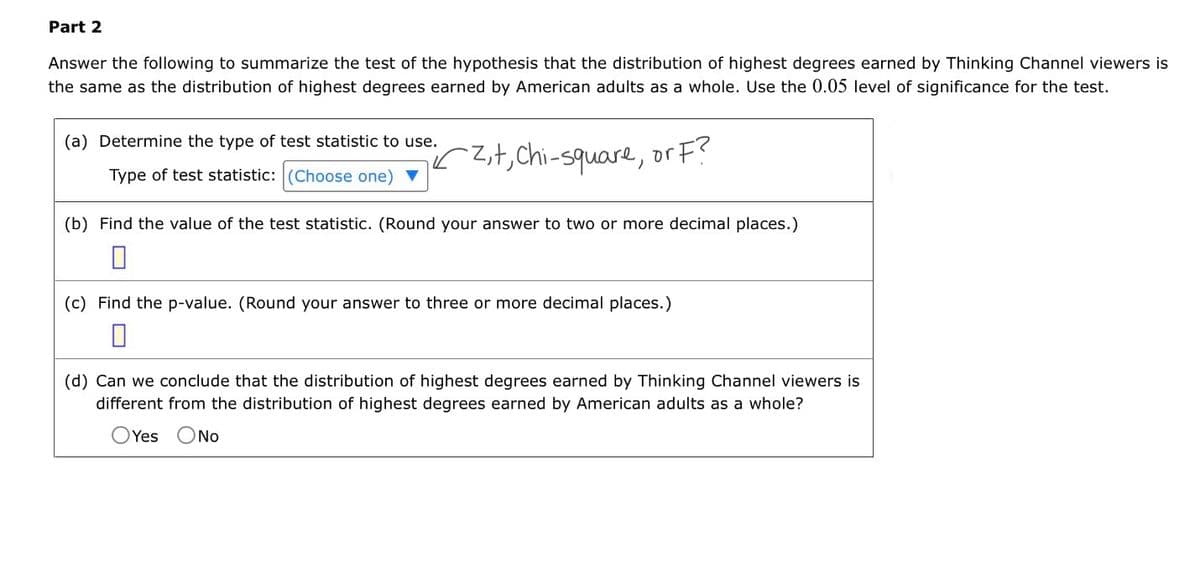
Transcribed Image Text:Part 2
Answer the following to summarize the test of the hypothesis that the distribution of highest degrees earned by Thinking Channel viewers is
the same as the distribution of highest degrees earned by American adults as a whole. Use the 0.05 level of significance for the test.
(a) Determine the type of test statistic to use.
Type of test statistic: (Choose one)
2+, Chi-square, or F?
(b) Find the value of the test statistic. (Round your answer to two or more decimal places.)
☐
(c) Find the p-value. (Round your answer to three or more decimal places.)
(d) Can we conclude that the distribution of highest degrees earned by Thinking Channel viewers is
different from the distribution of highest degrees earned by American adults as a whole?
O Yes No
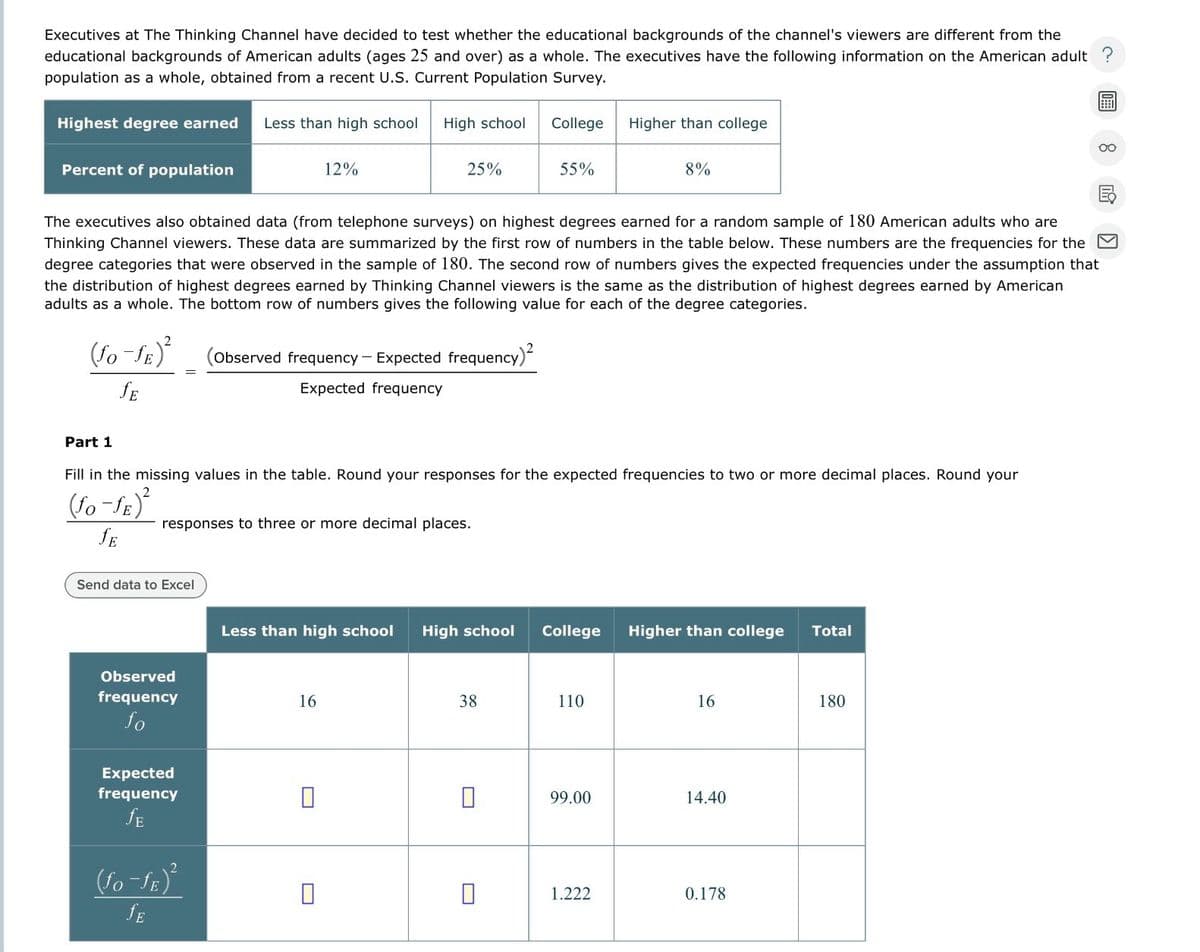
Transcribed Image Text:Executives at The Thinking Channel have decided to test whether the educational backgrounds of the channel's viewers are different from the
educational backgrounds of American adults (ages 25 and over) as a whole. The executives have the following information on the American adult ?
population as a whole, obtained from a recent U.S. Current Population Survey.
College
Highest degree earned Less than high school High school
Percent of population
12%
25%
55%
Higher than college
8%
00
☑
The executives also obtained data (from telephone surveys) on highest degrees earned for a random sample of 180 American adults who are
Thinking Channel viewers. These data are summarized by the first row of numbers in the table below. These numbers are the frequencies for the
degree categories that were observed in the sample of 180. The second row of numbers gives the expected frequencies under the assumption that
the distribution of highest degrees earned by Thinking Channel viewers is the same as the distribution of highest degrees earned by American
adults as a whole. The bottom row of numbers gives the following value for each of the degree categories.
(fo-ƒE)²
SE
(Observed frequency - Expected frequency)²
Expected frequency
Part 1
Fill in the missing values in the table. Round your responses for the expected frequencies to two or more decimal places. Round your
(So-SE)
responses to three or more decimal places.
SE
Send data to Excel
Observed
frequency
fo
Expected
frequency
SE
(So-fE)²
JE
Less than high school High school
College
Higher than college
Total
16
38
110
16
180
☐
99.00
14.40
☐
1.222
0.178
Expert Solution
This question has been solved!
Explore an expertly crafted, step-by-step solution for a thorough understanding of key concepts.

This is a popular solution!

Trending now
This is a popular solution!

Step by step
Solved in 2 steps

Recommended textbooks for you
Glencoe Algebra 1, Student Edition, 9780079039897…
Algebra
ISBN:
9780079039897
Author:
Carter
Publisher:
McGraw Hill
Glencoe Algebra 1, Student Edition, 9780079039897…
Algebra
ISBN:
9780079039897
Author:
Carter
Publisher:
McGraw Hill