Exercise 1: Data for a sample of checks from the Metro Diner from this past week can be found in the Excel worksheet titled Exercise1 and is shown below: $77 $55 $85 $91 $71 $6 $99 $78 $73 $75 $53 $50 $58 $60 $74 $66 $67 $77 $73 $74 $85 $69 $103 $59 $71 $57 $99 $85 $62 $70 $77 $94 $68 $97 $85 $55 $99 $57 $56 your answers on the examples shown in Clear-Sighted Statistics. $72 Model A. How many classes would you recommend? Use the 2 to thek rule: 2k > n. B. What class interval would you suggest? Use this formula: H-L i2- k C. Construct a frequency distribution, relative frequency distribution, a cumulative frequency distribution, and a cumulative relative frequency distribution. Show all four distributions on a single table. Paste your frequency distributions from Excel into Word using the instructions shown in the instructions to this assignment.
Exercise 1: Data for a sample of checks from the Metro Diner from this past week can be found in the Excel worksheet titled Exercise1 and is shown below: $77 $55 $85 $91 $71 $6 $99 $78 $73 $75 $53 $50 $58 $60 $74 $66 $67 $77 $73 $74 $85 $69 $103 $59 $71 $57 $99 $85 $62 $70 $77 $94 $68 $97 $85 $55 $99 $57 $56 your answers on the examples shown in Clear-Sighted Statistics. $72 Model A. How many classes would you recommend? Use the 2 to thek rule: 2k > n. B. What class interval would you suggest? Use this formula: H-L i2- k C. Construct a frequency distribution, relative frequency distribution, a cumulative frequency distribution, and a cumulative relative frequency distribution. Show all four distributions on a single table. Paste your frequency distributions from Excel into Word using the instructions shown in the instructions to this assignment.

Functions and Change: A Modeling Approach to College Algebra (MindTap Course List)
6th Edition
ISBN:9781337111348
Author:Bruce Crauder, Benny Evans, Alan Noell
Publisher:Bruce Crauder, Benny Evans, Alan Noell
Chapter5: A Survey Of Other Common Functions
Section5.3: Modeling Data With Power Functions
Problem 6E: Urban Travel Times Population of cities and driving times are related, as shown in the accompanying...

Related questions
Question
For number E you can just draw it on a paper or something so i can get an idea how it should be thank you
Transcribed Image Text:D.
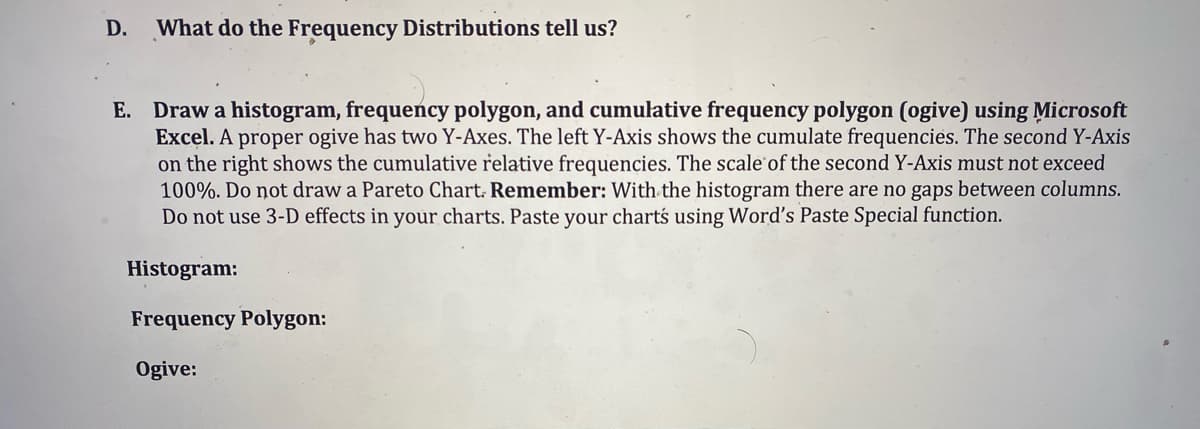
What do the Frequency Distributions tell us?
E. Draw a histogram, frequency polygon, and cumulative frequency polygon (ogive) using Microsoft
Excel. A proper ogive has two Y-Axes. The leftY-Axis shows the cumulate frequencies. The second Y-Axis
on the right shows the cumulative relative frequencies. The scale of the second Y-Axis must not exceed
100%. Do not draw a Pareto Chart. Remember: With the histogram there are no gaps between columns.
Do not use 3-D effects in your charts. Paste your charts using Word's Paste Special function.
Histogram:
Frequency Polygon:
Ogive:
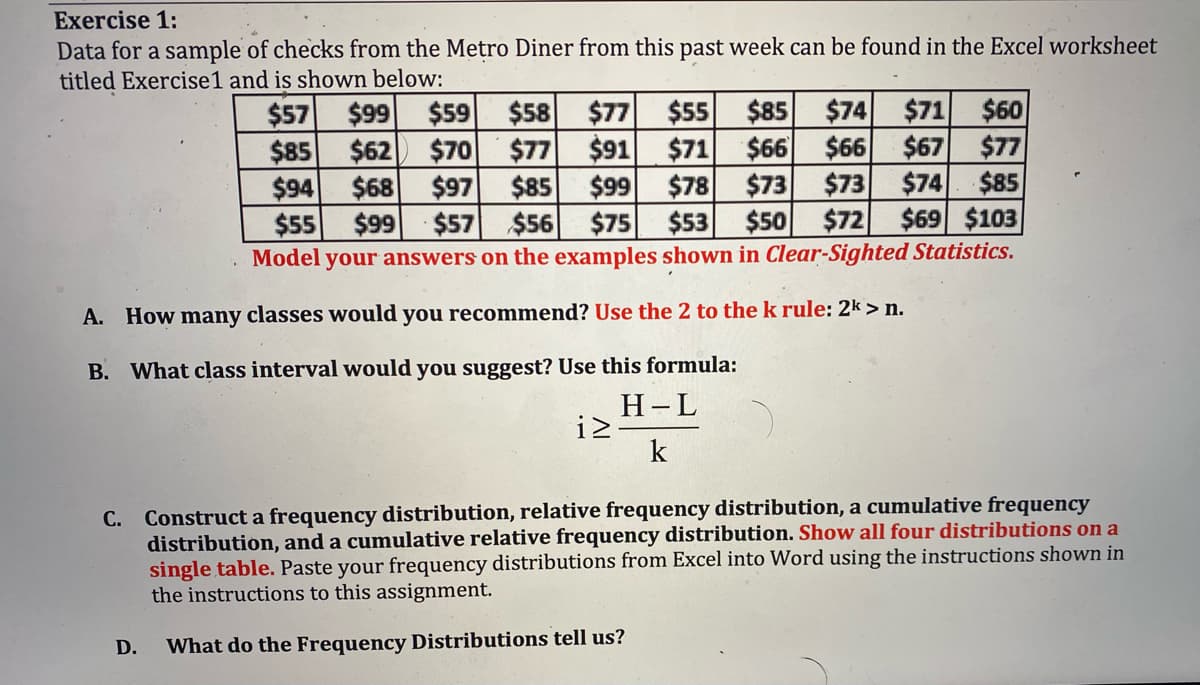
Transcribed Image Text:Exercise 1:
Data for a sample of checks from the Metro Diner from this past week can be found in the Excel worksheet
titled Exercise1 and is shown below:
$74 $71
$60
$66 $66 $67
$77
$74
$85
$73
$50 $72 $69 $103
$85
$57 $99 $59
$85 $62 $70
$94
$55
$77
$58
$91 $71
$77
$78
$85 $99
$56 $75 $53
$73
$68 $97
$99
$57
$55
Model your answers on the examples shown in Clear-Sighted Statistics.
A. How many classes would you recommend? Use the 2 to the k rule: 2k > n.
B. What class interval would you suggest? Use this formula:
Н-L
iz-
k
Construct a frequency distribution, relative frequency distribution, a cumulative frequency
distribution, and a cumulative relative frequency distribution. Show all four distributions on a
single table. Paste your frequency distributions from Excel into Word using the instructions shown in
the instructions to this assignment.
С.
D.
What do the Frequency Distributions tell us?
Expert Solution
This question has been solved!
Explore an expertly crafted, step-by-step solution for a thorough understanding of key concepts.

Step by step
Solved in 4 steps

Recommended textbooks for you
Functions and Change: A Modeling Approach to Coll…
Algebra
ISBN:
9781337111348
Author:
Bruce Crauder, Benny Evans, Alan Noell
Publisher:
Cengage Learning
Functions and Change: A Modeling Approach to Coll…
Algebra
ISBN:
9781337111348
Author:
Bruce Crauder, Benny Evans, Alan Noell
Publisher:
Cengage Learning