Exercise 2: There are approximately 13,500 taxicab medallions in NYC. The medallion is fixed to a taxicabs' hood. The Sheet titled Exercise2 shows a sample of 50 taxicabs listing the car model and his shown below. Toyota RAV4 Toyota Sienna Nissan NV Toyota Sienna Nissan NV Ford Transit Nissan NV Ford Transit Nissan NV Ford Transit Nissan NV Toyota Sienna Toyota Prius Toyota RAV4 Dodge Caravan Toyota Sienna Dodge Caravan Ford Transit Ford Transit Toyota Sienna Toyota Prius Toyota Sienna Toyota Sienna Nissan NV Ford Transit Ford Transit Ford Transit |Toyota RAV4 Toyota Sienna Dodge Caravan Toyota RAV4 Nissan NV Toyota Sienna Toyota Prius |Toyota RAV4 |Toyota Sienna Dodge Caravan |Toyota Sienna Ford Transit Toyota Prius Nissan NV Ford Transit Ford Transit Dodge Caravan Ford Transit Nissan NV Ford Transit |Toyota Sienna Toyota Sienna Toyota Prius Model your answers on the examples shown in Clear-Sighted Statistics. A. Construct a frequency table of the approved taxicab models in the sample. Show the Frequencies and Relative Frequencies. Use Excel's COUNTIF and SUM functions. B. Present the frequency table as a chart. Draw your chart using Microsoft Excel. DO NOT USE A PIE CHART! C. Comment on your findings.
Exercise 2: There are approximately 13,500 taxicab medallions in NYC. The medallion is fixed to a taxicabs' hood. The Sheet titled Exercise2 shows a sample of 50 taxicabs listing the car model and his shown below. Toyota RAV4 Toyota Sienna Nissan NV Toyota Sienna Nissan NV Ford Transit Nissan NV Ford Transit Nissan NV Ford Transit Nissan NV Toyota Sienna Toyota Prius Toyota RAV4 Dodge Caravan Toyota Sienna Dodge Caravan Ford Transit Ford Transit Toyota Sienna Toyota Prius Toyota Sienna Toyota Sienna Nissan NV Ford Transit Ford Transit Ford Transit |Toyota RAV4 Toyota Sienna Dodge Caravan Toyota RAV4 Nissan NV Toyota Sienna Toyota Prius |Toyota RAV4 |Toyota Sienna Dodge Caravan |Toyota Sienna Ford Transit Toyota Prius Nissan NV Ford Transit Ford Transit Dodge Caravan Ford Transit Nissan NV Ford Transit |Toyota Sienna Toyota Sienna Toyota Prius Model your answers on the examples shown in Clear-Sighted Statistics. A. Construct a frequency table of the approved taxicab models in the sample. Show the Frequencies and Relative Frequencies. Use Excel's COUNTIF and SUM functions. B. Present the frequency table as a chart. Draw your chart using Microsoft Excel. DO NOT USE A PIE CHART! C. Comment on your findings.

Holt Mcdougal Larson Pre-algebra: Student Edition 2012
1st Edition
ISBN:9780547587776
Author:HOLT MCDOUGAL
Publisher:HOLT MCDOUGAL
Chapter11: Data Analysis And Probability
Section11.4: Collecting Data
Problem 6E

Related questions
Question
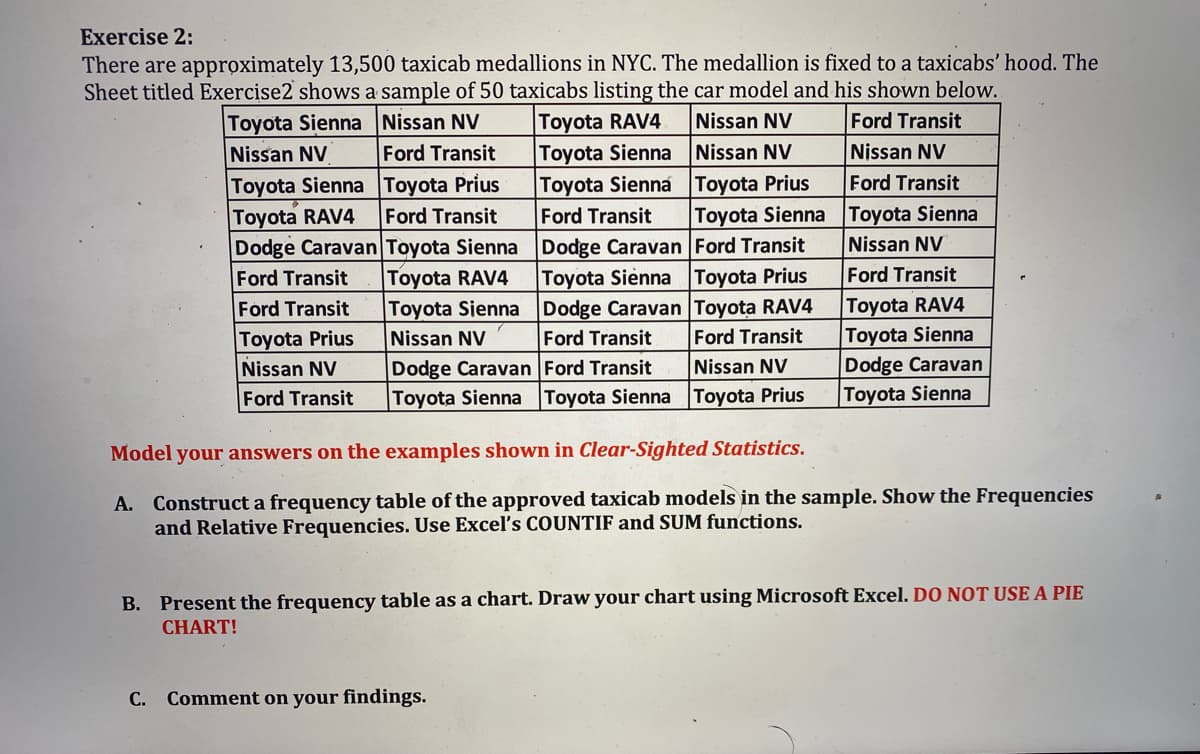
Transcribed Image Text:Exercise 2:
There are approximately 13,500 taxicab medallions in NYC. The medallion is fixed to a taxicabs' hood. The
Sheet titled Exercise2 shows a sample of 50 taxicabs listing the car model and his shown below.
|Toyota RAV4
Toyota Sienna Nissan NV
Toyota Sienna Nissan NV
Ford Transit
Toyota Sienna Toyota Prius
Ford Transit
Nissan NV
Ford Transit
Nissan NV
Nissan NV
Toyota Sienna Toyota Prius
Ford Transit
Toyota Sienna Toyota Sienna
Nissan NV
Toyota RAV4
Ford Transit
Dodge Caravan Toyota Sienna Dodge Caravan Ford Transit
Toyota Sienna Toyota Prius
Toyota Sienna Dodge Caravan Toyota RAV4
Ford Transit
Ford Transit
Toyota RAV4
Ford Transit
|Toyota RAV4
|Toyota Sienna
Dodge Caravan
|Toyota Sienna
Ford Transit
Toyota Prius
Nissan NV
Ford Transit
Nissan NV
Ford Transit
Dodge Caravan Ford Transit
Toyota Sienna Toyota Sienna Toyota Prius
Nissan NV
Model your answers on the examples shown in Clear-Sighted Statistics.
A. Construct a frequency table of the approved taxicab models in the sample. Show the Frequencies
and Relative Frequencies. Use Excel's COUNTIF and SUM functions.
B. Present the frequency table as a chart. Draw your chart using Microsoft Excel. DO NOT USE A PIE
CHART!
C. Comment on your findings.
Expert Solution
This question has been solved!
Explore an expertly crafted, step-by-step solution for a thorough understanding of key concepts.

This is a popular solution!

Trending now
This is a popular solution!

Step by step
Solved in 2 steps with 2 images

Recommended textbooks for you
Holt Mcdougal Larson Pre-algebra: Student Edition…
Algebra
ISBN:
9780547587776
Author:
HOLT MCDOUGAL
Publisher:
HOLT MCDOUGAL

Big Ideas Math A Bridge To Success Algebra 1: Stu…
Algebra
ISBN:
9781680331141
Author:
HOUGHTON MIFFLIN HARCOURT
Publisher:
Houghton Mifflin Harcourt
Holt Mcdougal Larson Pre-algebra: Student Edition…
Algebra
ISBN:
9780547587776
Author:
HOLT MCDOUGAL
Publisher:
HOLT MCDOUGAL
Big Ideas Math A Bridge To Success Algebra 1: Stu…
Algebra
ISBN:
9781680331141
Author:
HOUGHTON MIFFLIN HARCOURT
Publisher:
Houghton Mifflin Harcourt