Exercise 3: Measures of Location and Dispersion AB C D E F 1 4 26 49 62 81 Ans. Function 2. 12 28 49 63 82 =MODE(A1:E14) {=MODE.MULT(A1:E14)} {=MODE.MULT(A1:E14)} {=MODE.MULT(A1:E14)} Mode 3. 12 29 49 64 83 Array Function 13 33 50 68 85 15 35 50 68 87 16 35 53 69 90 4. {=MODE.MULT(A1:E14)} =MEDIAN(A1:E14) =AVERAGE(A1:E14) =MAX(A1:E14)-MIN(A1:E14) =AVEDEV(A1:E14) =VAR.P(A1:E14) =VAR.S(A1:E14) =STDEV.P(A1:E14) =STDEV.S(A1:E14) 7 17 40 54 69 91 Median 8. 18 41 54 69 91 Мean 9. 20 41 55 69 93 Range 10 20 43 59 75 94 20 43 59 77 -99 12 20 45 60 78 99 13 22 45 62 79 99 MAD Pop Var. Sample Var. 11 Pop Std Dev 14 25 48 62 80 99 15 Treat all five columns as one data set. 16 Round of fractional numbers to the hundredths column (0.00) 17 Array Functions: Sample Std Dev 18 1. Select multiple cells where you want to see the results. 19 2. Enter the formula. 20 3. On Windows: Press Contro+ShiftHEnter. Excel fills in the selected cells with the results. 21 4. On a Mac: Press Command+Return. Using this data calculate the following measures: • Mode: • Median:
Exercise 3: Measures of Location and Dispersion AB C D E F 1 4 26 49 62 81 Ans. Function 2. 12 28 49 63 82 =MODE(A1:E14) {=MODE.MULT(A1:E14)} {=MODE.MULT(A1:E14)} {=MODE.MULT(A1:E14)} Mode 3. 12 29 49 64 83 Array Function 13 33 50 68 85 15 35 50 68 87 16 35 53 69 90 4. {=MODE.MULT(A1:E14)} =MEDIAN(A1:E14) =AVERAGE(A1:E14) =MAX(A1:E14)-MIN(A1:E14) =AVEDEV(A1:E14) =VAR.P(A1:E14) =VAR.S(A1:E14) =STDEV.P(A1:E14) =STDEV.S(A1:E14) 7 17 40 54 69 91 Median 8. 18 41 54 69 91 Мean 9. 20 41 55 69 93 Range 10 20 43 59 75 94 20 43 59 77 -99 12 20 45 60 78 99 13 22 45 62 79 99 MAD Pop Var. Sample Var. 11 Pop Std Dev 14 25 48 62 80 99 15 Treat all five columns as one data set. 16 Round of fractional numbers to the hundredths column (0.00) 17 Array Functions: Sample Std Dev 18 1. Select multiple cells where you want to see the results. 19 2. Enter the formula. 20 3. On Windows: Press Contro+ShiftHEnter. Excel fills in the selected cells with the results. 21 4. On a Mac: Press Command+Return. Using this data calculate the following measures: • Mode: • Median:

Algebra & Trigonometry with Analytic Geometry
13th Edition
ISBN:9781133382119
Author:Swokowski
Publisher:Swokowski
Chapter3: Functions And Graphs
Section3.3: Lines
Problem 76E

Related questions
Question
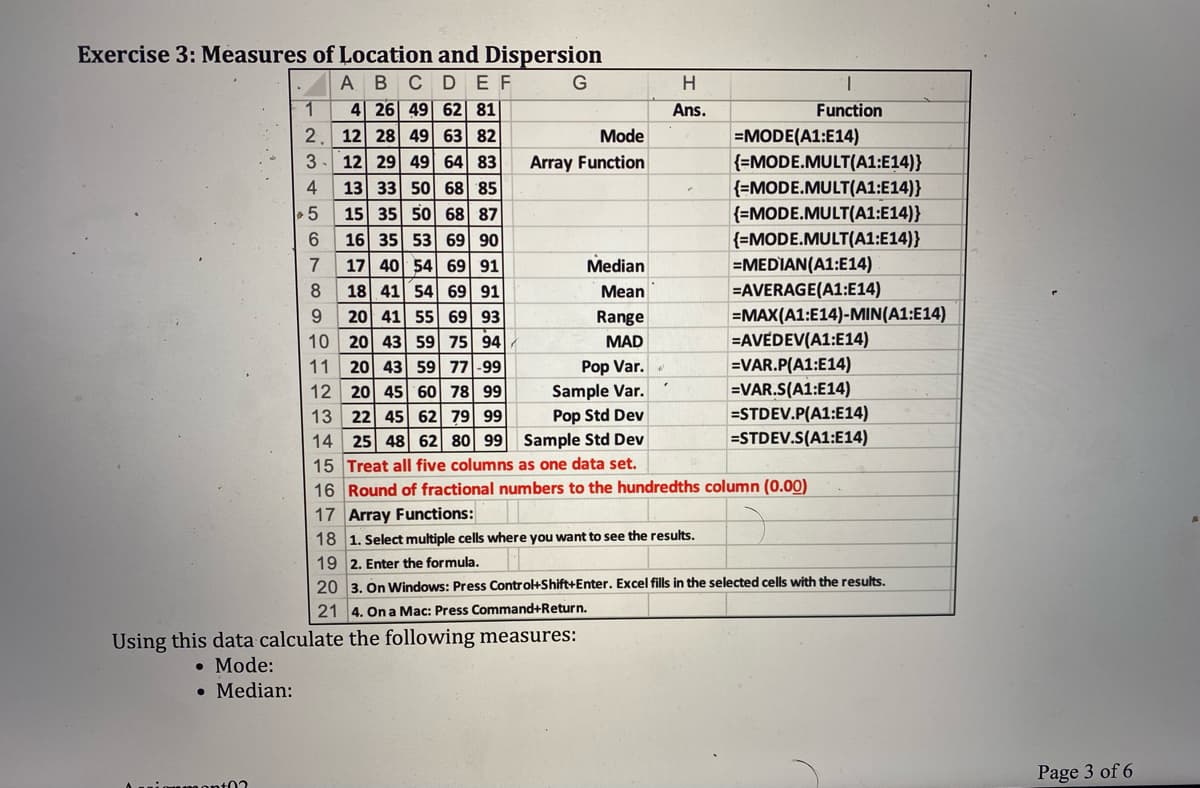
Transcribed Image Text:Exercise 3: Measures of Location and Dispersion
A BCDEF
G
H.
1
4 26 49 62 81
Ans.
Function
12 28 49 63 82
12 29 49 64 83
Mode
=MODE(A1:E14)
{=MODE.MULT(A1:E14)}
{=MODE.MULT(A1:E14)}
{=MODE.MULT(A1:E14)}
{=MODE.MULT(A1:E14)}
=MEDIAN(A1:E14)
=AVERAGE(A1:E14)
=MAX(A1:E14)-MIN(A1:E14)
=AVEDEV(A1:E14)
=VAR.P(A1:E14)
=VAR.S(A1:E14)
=STDEV.P(A1:E14)
=STDEV.S(A1:E14)
3
Array Function
13 33 50 68 85
15 35 50 68 87
6.
16 35 53 69 90
17 40 54 69 91
7
Median
18 41 54 69 91
20 41 55 69 93
10 20 43 59 75 94
8
Mean
9.
Range
MAD
Pop Var.
Sample Var.
Pop Std Dev
11
20 43 59 77 -99
12
20 45 60 78 99
22 45 62 79 99
14 25 48 62 80 99
15 Treat all five columns as one data set.
16 Round of fractional numbers to the hundredths column (0.00)
17 Array Functions:
13
Sample Std Dev
18 1. Select multiple cells where you want to see the results.
19 2. Enter the formula.
20 3. On Windows: Press Control+Shift+Enter. Excel fills in the selected cells with the results.
21 4. On a Mac: Press Command+Return.
Using this data calculate the following measures:
• Mode:
• Median:
Page 3 of 6
mont0?
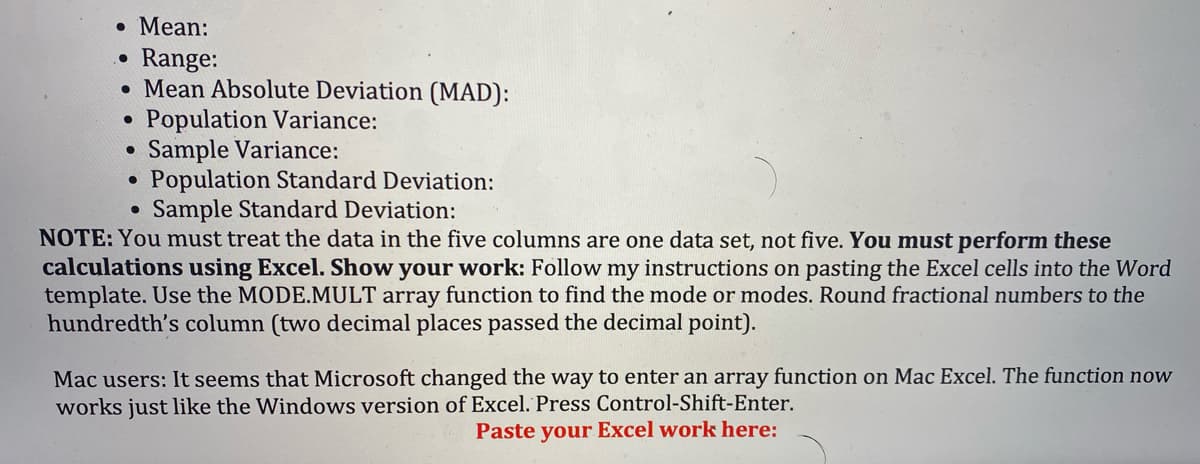
Transcribed Image Text:• Mean:
Range:
• Mean Absolute Deviation (MAD):
Population Variance:
• Sample Variance:
Population Standard Deviation:
Sample Standard Deviation:
NOTE: You must treat the data in the five columns are one data set, not five. You must perform these
calculations using Excel. Show your work: Follow my instructions on pasting the Excel cells into the Word
template. Use the MODE.MULT array function to find the mode or modes. Round fractional numbers to the
hundredth's column (two decimal places passed the decimal point).
Mac users: It seems that Microsoft changed the way to enter an array function on Mac Excel. The function now
works just like the Windows version of Excel. Press Control-Shift-Enter.
Paste your Excel work here:
Expert Solution
This question has been solved!
Explore an expertly crafted, step-by-step solution for a thorough understanding of key concepts.

This is a popular solution!

Trending now
This is a popular solution!

Step by step
Solved in 2 steps with 1 images

Recommended textbooks for you
Algebra & Trigonometry with Analytic Geometry
Algebra
ISBN:
9781133382119
Author:
Swokowski
Publisher:
Cengage


Big Ideas Math A Bridge To Success Algebra 1: Stu…
Algebra
ISBN:
9781680331141
Author:
HOUGHTON MIFFLIN HARCOURT
Publisher:
Houghton Mifflin Harcourt
Algebra & Trigonometry with Analytic Geometry
Algebra
ISBN:
9781133382119
Author:
Swokowski
Publisher:
Cengage
Big Ideas Math A Bridge To Success Algebra 1: Stu…
Algebra
ISBN:
9781680331141
Author:
HOUGHTON MIFFLIN HARCOURT
Publisher:
Houghton Mifflin Harcourt

Glencoe Algebra 1, Student Edition, 9780079039897…
Algebra
ISBN:
9780079039897
Author:
Carter
Publisher:
McGraw Hill

Holt Mcdougal Larson Pre-algebra: Student Edition…
Algebra
ISBN:
9780547587776
Author:
HOLT MCDOUGAL
Publisher:
HOLT MCDOUGAL